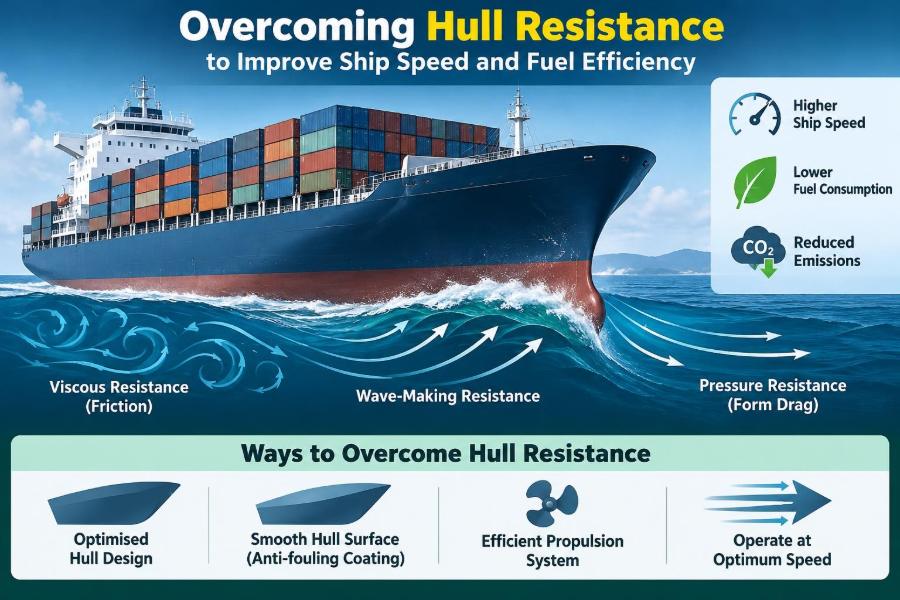

A vessel leaves berth with a clean schedule, a familiar route, and engines that appear to be performing normally. Yet the bridge team notices that holding the usual service speed needs more power than expected. The difference may be only a few knots or a modest rise in fuel consumption, but over a voyage it becomes operationally significant.
Often, the explanation is not hidden inside the engine room. It is in the water flowing around the hull. Every ship must push water aside, create waves, overcome friction, and move appendages through a dense, moving fluid. Together, these effects are called hull resistance.
Hull resistance determines how much effective power a ship needs to achieve a given speed. Because propulsion power rises sharply as speed increases, a relatively small increase in resistance can have a disproportionate impact on fuel use, emissions, machinery loading, and voyage planning.
For marine engineers, naval architects, deck officers, and anyone involved in ship operations, understanding resistance turns a broad instruction—“save fuel”—into practical choices about hull condition, trim, speed, maintenance, and design.
🌊 Hull Resistance in Plain Terms
Hull resistance is the force that opposes a ship’s forward motion through water. It is not one single force. It is the combined result of several physical effects acting on the hull, its appendages, and sometimes the air-exposed parts of the vessel.
A simple analogy is walking through shallow water. The faster you walk, the more difficult it becomes to push water around your legs and create waves. A ship experiences the same principle at a much larger scale, although its shape, speed, loading condition, and sea state make the problem more complex.
To maintain steady speed, the propeller must generate thrust equal to total resistance. If resistance rises, the ship needs more delivered power, more fuel, or a reduction in speed.
⚙️ From Resistance to Engine Power
Resistance is commonly expressed as a force, while the power needed to overcome it is related to both force and speed. In simplified form, effective power equals resistance multiplied by ship speed. The propulsion plant must supply more than this effective power because losses occur between engine output, shaft rotation, propeller thrust, and the hull.
This distinction matters. A clean hull may reduce resistance, but the fuel-saving result also depends on propeller efficiency, engine condition, weather, and operational profile. Engineers should avoid treating any single improvement as isolated from the complete propulsion system.
At many operating speeds, required power increases roughly with the cube of speed as a useful operational approximation. The exact relationship varies by ship and condition, but the message is reliable: small speed increases can require much larger power increases.
🧭 Why Speed Has Such a High Cost
A ship does not encounter the same resistance pattern at every speed. At low and moderate speeds, frictional resistance often dominates for large displacement ships. As speed rises, wave-making effects may grow rapidly, especially when the hull approaches a speed range where its generated wave system becomes difficult to overcome.
Consider a hypothetical vessel that can meet a schedule at either 14 or 16 knots. The faster option is not merely 14 percent faster. Depending on hull form and conditions, it may demand substantially more power and fuel per day. Whether it saves fuel per voyage depends on time at sea, waiting time, port restrictions, and the ability to slow down elsewhere.
This is why speed optimization is a voyage-planning exercise, not simply an instruction to run slowly.
📏 The Main Components of Resistance
Naval architects commonly divide total resistance into components to understand where losses occur. The boundaries between components can be complex in practice, but the classification helps engineers diagnose problems and compare design options.
| Resistance component | What causes it | Typical operational influence |
|---|---|---|
| Frictional resistance | Viscous shear in the water layer along the wetted hull | Hull roughness, fouling, wetted area, speed |
| Form and pressure resistance | Flow separation and pressure differences around the hull form | Hull geometry, trim, appendages, damage |
| Wave-making resistance | Energy used to create surface waves | Speed, hull proportions, draft, trim |
| Appendage resistance | Drag from rudders, brackets, bilge keels, shafts, and thrusters | Alignment, design, fouling, operating condition |
| Air resistance | Wind acting on exposed structure and cargo | Wind speed, heading, deck configuration |
| Added resistance | Motion and flow effects in waves and wind | Sea state, heading, speed, loading |
No vessel eliminates these forces entirely. The engineering goal is to manage them intelligently through design, maintenance, and operation.
🫧 Frictional Resistance and the Boundary Layer
As water passes along a moving hull, a thin region near the surface is slowed by viscosity. This region is called the boundary layer. The hull must continuously transfer energy into this shearing flow, creating frictional resistance.
Friction depends strongly on wetted surface area and surface condition. A large tanker, bulk carrier, or container vessel has a substantial underwater area, so even slight roughness across that area can increase drag noticeably.
The boundary layer may be laminar in very limited regions but is predominantly turbulent over most full-scale ship hulls. Turbulent flow mixes more actively and produces higher skin friction, although it is also more resistant to early flow separation.
🦠 Biofouling: A Small Layer With a Large Effect
Biofouling includes slime, algae, shell-forming organisms, and other marine growth that attach to underwater surfaces. It raises surface roughness and disrupts the smooth flow assumed in clean-hull performance calculations.
Slime may look insignificant during an inspection, but it can still affect friction. More severe fouling, such as barnacles or tubeworms, adds roughness and changes local flow around the hull, sea chests, rudder, and propeller.
Fouling risk varies with water temperature, vessel activity, idle periods, coating condition, and trading pattern. A ship that remains inactive in a biologically active port can develop resistance penalties that are not apparent from routine engine readings alone.
🎨 Coatings Are a Performance System
Antifouling coatings are selected to control marine growth, but they also influence surface smoothness and durability. Their real-world performance depends on correct surface preparation, film thickness, curing, application conditions, and compatibility with the vessel’s operating profile.
A coating suited to a vessel trading continuously may behave differently on a ship with long lay-up periods or frequent slow steaming. Coating selection should therefore include expected idle time, docking interval, water temperature, cleaning policy, and environmental restrictions.
Damage, poor adhesion, and uneven repairs can create rough areas long before a dry-dock survey reveals major deterioration. A coating plan is not complete when paint is applied; it must be supported by inspection and performance monitoring.
🧽 Cleaning the Hull Without Creating New Losses
In-water hull cleaning can restore performance when conducted at the right time and by a competent provider. However, aggressive or unsuitable cleaning can damage coatings, expose corrosion protection systems, or leave a rougher surface than intended.
Before cleaning, operators should consider local port rules, waste capture requirements, coating type, fouling severity, and the likelihood of reinfestation. Cleaning a vessel in one location may remove organisms that must not be released into the surrounding environment.
The best decision is usually based on trend data: speed-power performance, fuel records, underwater inspection results, and time since docking. A visibly dirty hull deserves attention, but an evidence-based maintenance interval is better than cleaning automatically.
🌬️ Form Resistance and Flow Separation
Form resistance, sometimes described through viscous pressure effects, arises when water cannot follow the hull’s shape smoothly. If flow separates from the surface, it leaves a wake with lower pressure behind the body, increasing drag.
A streamlined aft body helps water recover pressure gradually as it approaches the propeller region. Abrupt shape changes, damaged plating, poorly faired repairs, and unsuitable appendage geometry can encourage separation and disturb the inflow to the propeller.
This is one reason fairing quality matters. A minor local defect may not add much area, but if it sits in a sensitive flow region, it can produce a larger-than-expected penalty.
🌊 Wave-Making Resistance and Hull Speed Effects
A displacement ship creates a pattern of bow and stern waves. The energy carried away by these waves is energy no longer available for forward motion. As speed rises, the wave pattern changes, and wave-making resistance can become a major share of total resistance.
The relationship is often discussed using the Froude number, a dimensionless value based on speed, gravity, and waterline length. It helps naval architects compare the significance of wave effects across vessels of different sizes.
The popular phrase “hull speed” can be useful as an introductory idea for conventional displacement craft, but it is not a hard speed limit. Ships can operate beyond simple rule-of-thumb values; they simply may require sharply increasing power unless their hull form is designed for semi-displacement or planing behavior.
📐 Hull Form: Design Choices That Set the Baseline
Length-to-beam ratio, block coefficient, bow shape, stern geometry, draft, and displacement all influence resistance. A fuller hull carries more volume within a given length, which can be useful for cargo capacity but may produce different wave and viscous characteristics than a slender hull.
There is no universally “best” hull shape. A fast passenger vessel, an ultra-large container ship, an ice-class supply vessel, and a coastal tanker face different constraints involving capacity, stability, seakeeping, construction, route, and cost.
Designers therefore optimize for an expected operating envelope rather than one perfect condition. A ship that is highly efficient at one draft and speed may be less favorable when lightly loaded, heavily ballasted, or operated well away from its design speed.
⚓ Bulbous Bows Need the Right Conditions
A bulbous bow can reduce wave-making resistance by interacting favorably with the bow-wave system. Its effectiveness depends on vessel speed, draft, loading condition, and hull geometry.
It is a common mistake to assume that a bulb always saves energy. At speeds or drafts far from the design condition, the expected wave interaction may weaken, and the bulb can add wetted area or create an unfavorable flow effect.
This does not make bulbous bows unreliable; it shows why operational data matters. If a vessel has moved permanently toward lower-speed operation, the original bow optimization may deserve review during retrofit studies.
🧱 Appendages Add More Than Their Size Suggests
Rudders, shaft brackets, struts, bilge keels, stabilizer fins, sonar domes, thruster tunnels, and other appendages create their own drag. They also interact with the hull’s boundary layer and can alter the flow arriving at the propeller.
Appendage resistance increases when surfaces foul, edges become damaged, or components are misaligned. A partially deployed stabilizer, a poorly maintained thruster tunnel, or a rudder held at a persistent angle can create avoidable losses.
Inspection programs should not focus only on the large flat areas of the hull. Complex geometry is often where fouling accumulates and where cleaning is most difficult.
🌀 The Propeller Cannot Be Separated From the Hull
Strictly speaking, propeller inefficiency is not hull resistance. Operationally, however, hull and propeller performance are tightly linked. The hull’s wake changes the speed and direction of water entering the propeller, while propeller suction and slipstream influence the stern flow.
A clean, correctly matched propeller converts shaft power into thrust more effectively. Rough blades, leading-edge damage, fouling, and distorted geometry increase losses and may contribute to vibration or cavitation.
When fuel use rises, a hull-only diagnosis can miss the cause. A useful investigation considers speed-power data alongside shaft power, rpm, propeller condition, engine load, weather, draft, and trim.
💥 Cavitation: Efficiency Loss and Material Risk
Cavitation occurs when local pressure around a propeller blade falls sufficiently for vapor-filled cavities to form and then collapse. Some cavitation can occur in normal high-load operation, but excessive or poorly controlled cavitation can reduce efficiency, generate noise and vibration, and erode blade surfaces.
Hull wake quality affects cavitation behavior. Uneven inflow can make blade loading fluctuate as each blade rotates through different wake regions. This is why stern design, propeller selection, and wake-field analysis are connected.
Changing rpm or pitch may reduce a cavitation problem in one condition but introduce a schedule or engine-loading penalty. Solutions need evaluation across the vessel’s actual operating range.
⚖️ Trim Changes Resistance
Trim is the difference between forward and aft draft. It changes the immersed hull shape, wetted area, wave pattern, and flow into the propeller. The most efficient trim is not automatically even keel, nor is it always the same for every loading condition.
A slight trim adjustment can sometimes reduce resistance, but the outcome depends on hull form and speed. Excessive stern trim may increase wetted surface and alter propeller immersion; excessive bow trim can affect wave-making behavior and seakeeping.
Trim optimization should respect safety margins, visibility, slamming risk, stability requirements, propeller immersion, and loading limitations. Fuel efficiency is one decision criterion, not permission to compromise safe operation.
🛳️ Draft and Displacement Change the Problem
Loading cargo increases displacement and draft. This usually increases wetted area and can raise frictional resistance, while also changing the vessel’s wave system and propeller submergence. The result is not always a simple linear increase in fuel demand.
Ballast condition can be especially challenging because the vessel may have reduced draft, different trim, exposed propeller effects, and an operating speed unlike the design condition. Windage may also become more important when a lightly loaded ship presents greater exposed side area.
Performance targets should therefore be compared against a similar loading condition whenever possible. Comparing one voyage’s fuel consumption directly with another, without accounting for displacement and weather, can lead to misleading conclusions.
🌧️ Added Resistance in Waves and Wind
In real seas, a ship pitches, heaves, rolls, and encounters changing wave orbital motion. These motions and impacts require energy, creating added resistance. Head seas often impose a substantial penalty, but oblique seas can also be operationally difficult because of steering demands and rolling.
Wind contributes direct aerodynamic drag and may cause leeway, requiring rudder angle to maintain track. Containers, deck cargo, cranes, accommodation blocks, and open deck arrangements all influence the exposed profile.
Calm-water trial results remain valuable, but they are a baseline rather than a promise of performance in service. Weather routing and realistic speed expectations are essential parts of resistance management.
🧭 Steering Losses and Rudder Angle
A rudder develops force by operating at an angle to the flow. That force is necessary for turning and course keeping, but it creates drag. Persistent rudder angle on a supposedly straight passage is a warning sign worth investigating.
Possible causes include weather, current, hull asymmetry, propeller transverse effects, autopilot settings, poor sensor calibration, or an unsuitable track for the prevailing conditions. The goal is not zero rudder movement—safe control requires correction—but avoiding unnecessary continuous steering effort.
Autopilot tuning should be reviewed carefully. Overly aggressive settings can produce repeated small corrections that increase rudder activity, while overly slow response can allow larger deviations and more severe corrections.
📉 Slow Steaming: Powerful but Not Free
Slow steaming reduces resistance and usually lowers required propulsion power significantly. It can be highly effective when schedules allow, but it changes the operating environment for the main engine, auxiliary systems, and voyage plan.
At sustained low load, some engines may require specific operating measures to maintain acceptable combustion, temperatures, lubrication, and component condition. The appropriate approach depends on engine type, manufacturer guidance, fuel, maintenance condition, and class or flag requirements.
Slow steaming also extends voyage duration. That can affect inventory, crewing patterns, charter commitments, port windows, and exposure to weather. The operational objective is not the lowest instantaneous fuel rate; it is the best safe and commercially workable voyage outcome.
🧮 Measuring Performance Without Misreading It
Performance monitoring compares what the vessel is doing with what would be expected under comparable conditions. Useful inputs can include speed through water, speed over ground, shaft power, rpm, fuel flow, draft, trim, wind, waves, current, water temperature, and hull-cleaning history.
Speed over ground is valuable for navigation but can be distorted by current when used to judge hull performance. Speed through water is often more relevant to hydrodynamic resistance, though its measurement also has limitations and requires calibration.
A single daily report rarely proves that a hull has fouled or that a retrofit has succeeded. Trends across comparable conditions are more informative than isolated observations.
📊 Establishing a Useful Baseline
A baseline should represent the vessel in a known, well-documented condition, ideally soon after docking, hull treatment, and propeller maintenance. It should describe draft, trim, displacement, speed range, machinery configuration, and environmental assumptions.
From there, operators can develop a speed-power curve or a practical performance model. The model need not be overly elaborate to be useful, but it must recognize that weather, current, loading, and sensor uncertainty affect the data.
When comparing results, ask whether the voyages are genuinely comparable. A clean-hull voyage in calm water at moderate draft is not a fair reference for a heavily laden voyage in head seas.
🔍 Diagnosing an Unexpected Fuel Increase
When consumption rises, begin with a structured check rather than assuming the main engine is at fault. Confirm the measured fuel quantity and flow data, then compare speed, shaft power, rpm, draft, trim, and weather with past conditions.
- Check whether speed loss is through water or only over ground because of current.
- Review hull and propeller inspection history, idle periods, and coating condition.
- Look for persistent rudder angle, increased vibration, or unusual steering behavior.
- Verify machinery condition, air and fuel systems, cooling temperatures, and engine loading.
- Consider route changes, sea state, wind direction, and shallow-water operation.
This process does not replace specialist analysis, but it helps separate a probable hydrodynamic problem from measurement error, weather effects, or machinery deterioration.
🏞️ Shallow Water and Restricted Channels
In shallow water, flow beneath the hull is constrained. The vessel may experience increased resistance, changes in trim, and squat—the tendency for the ship to sink deeper and often trim as speed rises. In narrow channels, bank effects and restricted flow add further complications.
These effects are safety-critical as well as efficiency-related. A speed that is acceptable in deep water can produce noticeably different handling and power demand in a channel or approach area.
Masters and pilots must prioritize under-keel clearance, maneuverability, local guidance, and traffic conditions. Fuel-saving targets should never encourage speeds that erode these margins.
🔧 Retrofits That Target Hydrodynamic Losses
Retrofit options include improved hull coatings, propeller polishing or redesign, pre-swirl devices, ducts, fins, rudder improvements, and energy-saving appendages. Some devices aim to condition flow before it reaches the propeller; others recover rotational energy in the propeller slipstream or reduce local separation.
Results are vessel-specific. A device that performs well on one hull, propeller, and operating profile may offer less value on another. Installation quality, structural implications, cavitation behavior, dry-dock time, and maintenance access all deserve review.
A credible retrofit decision combines model-scale or computational assessment where available with realistic service assumptions. Claimed benefits should be examined against the actual drafts, speeds, and routes the vessel will use.
💻 Computational Tools and Model Testing
Computational fluid dynamics, usually called CFD, allows designers to simulate flow around a hull and investigate pressure distribution, wake patterns, appendage interaction, and alternative shapes. It is particularly helpful for comparing design changes before steel is cut.
Towing-tank model tests remain valuable for assessing resistance and propulsion characteristics under controlled conditions. Scale effects must be considered when translating model results to a full-scale vessel, especially for viscous flow and roughness.
Neither method removes the need for sea-trial and in-service data. Numerical models rely on assumptions, and real vessels encounter variable weather, fouling, loading, and machinery conditions that are difficult to reproduce completely.
🧰 Dry-Dock Planning for Long-Term Efficiency
Dry docking provides the best opportunity to inspect, repair, and restore underwater performance. The scope should include more than repainting broad hull areas. It should consider propeller condition, rudder clearances, appendage fairing, sea-chest gratings, anodes, damage repairs, and the quality of the final surface.
Photographs and inspection notes create a useful record for future comparison. If an area repeatedly suffers coating failure or heavy fouling, the operator can investigate root causes rather than repeating the same repair specification.
Planning ahead matters because coating systems have preparation and curing requirements. Rushed work may reduce the useful life of an otherwise well-chosen solution.
🧑🔧 Roles Across the Ship and Shore Team
Resistance management crosses departmental boundaries. Deck teams observe speed, steering, weather, and draft. Engine teams monitor power, fuel flow, rpm, and machinery response. Shore staff coordinate performance analysis, procurement, docking, and commercial schedules.
Useful reporting is specific: “higher shaft power at comparable speed through water and draft following a prolonged idle period” is more actionable than “ship feels slow.” Clear records allow technical and operational teams to investigate the same problem using the same evidence.
Training should also explain why a requested trim, speed, or maintenance action is being considered. Crews make better decisions when they understand the physical trade-offs behind the instruction.
⚠️ Common Mistakes in Resistance Reduction
One frequent mistake is chasing a single daily fuel figure without correcting for current, weather, loading, and speed. Another is assuming that any cleaning or energy-saving device will pay back equally across all operating conditions.
Operators can also create problems by treating trim optimization as a fixed recipe, ignoring safety constraints, or running propulsion machinery at unsuitable low loads solely to reduce fuel consumption.
- Do not use speed over ground alone to judge hull condition.
- Do not postpone inspection simply because the engine can still make schedule.
- Do not interpret calm-water design data as all-weather service performance.
- Do not overlook propeller, rudder, and appendage condition.
- Do not trade safe handling margins for a narrow efficiency gain.
🎯 A Practical Improvement Cycle
An effective program follows a repeating cycle: measure performance, identify likely losses, select an intervention, verify results, and update the baseline. The intervention may be operational, such as a speed or trim adjustment, or physical, such as propeller maintenance or coating renewal.
Start with low-risk actions that improve data quality and operating discipline. Then use the findings to prioritize higher-cost dry-dock work or retrofits. This avoids spending heavily on a solution before confirming that it addresses the dominant loss.
The cycle should account for uncertainty. Marine performance data is noisy, so decisions are stronger when supported by repeated observations and transparent assumptions rather than a single favorable voyage.
🌍 Fuel Efficiency, Emissions, and Operational Resilience
Lower resistance means less energy is required for the same transport task. When a vessel uses less fuel at a given operating point, it can reduce operating cost and associated exhaust emissions, subject to the fuel and propulsion system in use.
Efficiency also improves resilience. A vessel with a clean hull and well-maintained propeller has more power margin available when weather deteriorates or schedule recovery is needed. It is easier to manage performance when routine losses are controlled.
The environmental value of resistance reduction should be considered alongside coating impacts, cleaning practices, dry-dock waste, and the full life of any retrofit. Good engineering looks at the complete consequence, not only fuel saved at sea.
✅ The Core Principle: Match the Whole System
Overcoming hull resistance is not about finding one magic device or always selecting the lowest speed. It is about matching hull condition, propeller performance, trim, draft, route, speed, machinery operation, and maintenance timing to the ship’s real service profile.
Start with the fundamentals: keep underwater surfaces fair and clean, maintain propeller and appendage condition, measure performance in comparable conditions, and avoid unnecessary speed and steering losses. Then use data to decide whether operational changes or technical upgrades offer the best next step.
The central lesson is simple: every kilowatt that is not wasted overcoming avoidable resistance becomes useful operating margin, lower fuel demand, or a more achievable schedule.
A ship moves efficiently when its hull, propeller, machinery, and operating plan work with the water rather than continually fighting it. That principle turns careful observation and routine maintenance into measurable maritime performance. 🚢🌊⚙️