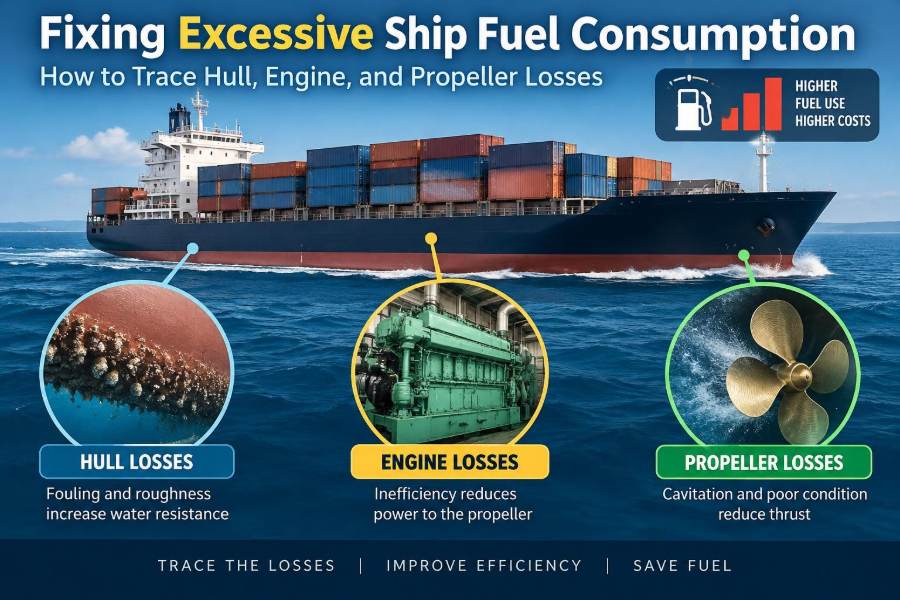

The noon report looks wrong. The vessel is holding the scheduled speed, weather has been ordinary, and cargo condition has not changed much—yet daily fuel consumption is climbing. The immediate question is usually, “What is wrong with the engine?”
Sometimes the engine is the answer. Just as often, it is only responding to extra resistance created elsewhere: a fouled hull, a damaged propeller, poor trim, a dragging brake, or an operating point that has moved away from the machinery’s efficient range.
Fuel troubleshooting is difficult because a ship is an energy chain. Fuel energy becomes shaft power, shaft power becomes thrust, and thrust overcomes hull resistance. A loss at any point changes the readings seen at the engine.
A disciplined investigation separates real deterioration from misleading data, then traces the loss through hull, propeller, shaft line, engine, and operation. That approach avoids expensive maintenance that solves the wrong problem.
🧭 Start With the Right Question
Do not begin with “Which component is defective?” Begin with “What changed, under comparable operating conditions?” Fuel consumption cannot be judged meaningfully from one voyage or one daily report.
A ship burning more fuel may be facing stronger wind, adverse current, a deeper draft, lower-quality fuel, reduced shaft efficiency, or a genuine machinery fault. The aim is to distinguish these possibilities before assigning blame.
⚖️ Understand the Energy Chain
Think of propulsion as a chain of conversions. The main engine releases chemical energy from fuel. The shaft line transmits mechanical power, the propeller converts that power into thrust, and the hull moves through water against resistance.
Losses multiply rather than simply add. A modest increase in hull resistance may require substantially more delivered power because resistance rises rapidly as speed increases. That extra power then raises engine load and fuel use.
📏 Define the Performance Baseline
A baseline is a trusted picture of normal performance for a particular vessel. It should connect speed, draft, trim, displacement, shaft power or rpm, fuel consumption, weather, and route condition.
The most useful baseline usually comes from several clean, steady operating periods, not from design-trial figures alone. Trial conditions are highly controlled and may not represent a ship’s normal draft, age, loading pattern, or service speed.
🗂️ Collect Comparable Operating Data
Before opening equipment or arranging an underwater inspection, gather reports from a meaningful period before and after the suspected change. Look for trends rather than isolated peaks.
- Fuel quantity consumed, with tank soundings or flow-meter checks where available
- Speed through water and speed over ground
- Engine rpm, shaft power, torque, and load index if fitted
- Draft, displacement, trim, and ballast condition
- Wind, waves, swell, current, sea temperature, and route
- Propeller pitch for controllable-pitch installations
- Maintenance dates, dry-docking dates, and fuel changes
Data quality matters as much as data quantity. An incorrect draft, a drifting flow meter, or a speed log affected by fouling can create a convincing but false performance story.
🌊 Separate Speed Through Water From Speed Over Ground
Speed over ground includes the effect of current. A following current can make a vessel appear efficient, while an opposing current can suggest a propulsion problem where none exists.
For hull and propeller assessment, speed through water is generally the more relevant comparison. It represents the vessel’s motion relative to the surrounding water, though the speed log itself must be validated when fouling or sensor errors are suspected.
🌦️ Normalize for Weather and Route
Sea margin exists because real seas impose extra resistance. Wind acting on exposed hull and deck area, waves causing added resistance, and rudder activity in yawing all increase the power needed to maintain speed.
A northbound passage and a southbound passage may not be comparable even on the same route. Use periods with similar weather, heading, loading, and speed whenever possible. If a performance model is available, use it carefully and understand its assumptions.
🚢 Check Draft, Displacement, and Trim
A vessel’s underwater shape changes with loading. More displacement increases wetted surface and wave-making characteristics, while trim changes how water flows around the hull and into the propeller.
Small trim changes can be operationally worthwhile on some ships, but there is no universal “best trim.” The preferred condition varies with hull form, displacement, speed, sea state, and propeller immersion. Compare like with like before declaring that trim is the cause.
🧪 Verify the Fuel Measurement First
Fuel use is often calculated from bunker tank levels, which can be affected by sounding error, tank temperature, vessel motion, transfers, settling, and unrecorded consumption by auxiliary equipment. A daily discrepancy does not automatically mean the main engine has become inefficient.
Where installed, mass flow meters can improve resolution, but they also require correct configuration, maintenance, and cross-checking. Reconcile measured consumption with tank inventory over an appropriate period.
📈 Read the Power-Speed Relationship
One of the clearest diagnostic tools is a power-speed curve. If the vessel now needs more shaft power to achieve the same speed through water at similar displacement and weather, total propulsion resistance has increased or propulsion efficiency has fallen.
If fuel consumption rises while shaft power remains similar, investigate engine efficiency, fuel properties, auxiliary loads, and measurement error. If shaft power rises at the same speed, look first toward hull, propeller, appendages, or unusual operating resistance.
🦠 Recognize Hull Fouling Signatures
Hull fouling ranges from slime, which can alter surface roughness, to weed, shell growth, and other hard marine growth. Even a thin biofilm can affect frictional resistance; heavier growth can create a much more obvious speed-power penalty.
The typical signature is gradual deterioration after cleaning or dry dock, often accelerating during long idle periods, slow steaming, or operation in high-fouling waters. It is not always visible from onboard inspections because the most influential areas may be below the waterline.
🎨 Consider Coating Condition, Not Just Growth
An apparently clean hull is not necessarily hydraulically smooth. Coating damage, rough repairs, corrosion, peeling systems, and uneven paint edges all disturb boundary-layer flow—the thin layer of water moving close to the hull surface.
Antifouling coatings manage biological attachment; they do not eliminate the need for condition assessment. A coating choice must also suit trading pattern, idle time, regulatory restrictions, application quality, and expected docking interval.
🔍 Inspect the Underwater Hull Strategically
Diver or remotely operated vehicle inspections can confirm fouling, but the report should identify where growth is concentrated. Flat bottom, boot-top, bilge keels, sea chests, bow thruster tunnels, rudder surfaces, and transom areas may behave differently.
Photographs should be interpreted alongside the vessel’s operating history. A light coating of slime found after a performance decline supports one explanation; extensive growth found after no measurable decline may indicate that the operating comparison was poor.
🧹 Balance Hull Cleaning Benefits and Risks
Underwater cleaning may recover performance, but it is not automatically appropriate. Aggressive tools can damage coatings, and removed organisms or coating debris can create environmental, port, or biosecurity concerns.
Plan cleaning based on inspection evidence, coating manufacturer guidance, local requirements, and an assessment of expected fuel recovery. Record pre-cleaning and post-cleaning performance so the decision improves future maintenance planning.
🪸 Do Not Forget Appendages and Sea Chests
Appendages create drag disproportionate to their size because they interrupt flow. Bilge keels, stabilizer fins, thruster tunnels, shaft brackets, struts, rudders, and sea-chest gratings deserve attention during an underwater survey.
Blocked sea chests also affect cooling-water availability. The propulsion consequence may then appear as rising temperatures, reduced allowable load, or increased auxiliary pump demand rather than as a simple increase in hull resistance.
⚓ Examine Propeller Surface Condition
A propeller is designed to work with a precise blade shape and surface condition. Fouling, shell growth, roughness, coating loss, pitting, and leading-edge damage alter the blade’s ability to develop thrust efficiently.
Because propeller flow is already energetic and non-uniform, local defects can matter. A rough or fouled propeller may require higher rpm or power for the same speed and may also increase vibration, noise, and the likelihood of cavitation.
🔧 Look for Propeller Damage and Deformation
Contact with debris, grounding, ice, or floating objects can bend blade tips, nick edges, or create cracks. Damage is not always dramatic enough to cause an immediate alarm, but it can shift the propeller’s balance and hydrodynamic performance.
Inspection should consider blade geometry, edge condition, tip clearance, hub condition, and evidence of rubbing. Repairs should follow approved procedures; indiscriminate grinding can remove material from one blade and create a new imbalance.
🫧 Understand Cavitation Without Guesswork
Cavitation occurs when local pressure falls enough for vapor-filled cavities to form and collapse. Some cavitation can be expected in propeller operation, but excessive or damaging cavitation can erode blade surfaces, create vibration, and reduce efficiency.
It is not proven merely by hearing noise or seeing a power increase. Confirmation may require inspection of erosion patterns, vibration records, operating data, and specialist analysis. Changes in draft, trim, wake flow, blade damage, or rpm can all influence it.
🔩 Check Shaft Line and Bearing Losses
Not all shaft power reaches the propeller unchanged. Misalignment, bearing deterioration, inadequate lubrication, abnormal seal friction, or gearbox problems can increase mechanical losses or impose operating limits.
Monitor bearing temperatures, vibration, lube-oil condition, shaft movement where measured, and seal leakage trends. A single hot bearing is a safety and reliability concern, not merely an efficiency issue, and should be investigated under the vessel’s maintenance procedures.
⚙️ Distinguish Engine Power From Engine Efficiency
An engine can produce the required power while using more fuel per unit of energy delivered. This is described by specific fuel oil consumption: fuel consumed per unit of power over time. It is more revealing than total daily consumption when comparing engine condition.
However, calculations depend on accurate fuel measurement and reliable power data. Treat a calculated change as a diagnostic clue, then confirm it with trend data and equipment checks.
🔥 Investigate Air, Fuel, and Combustion Quality
Efficient combustion needs the right fuel condition, correct injection, adequate scavenge air, effective compression, and a sound exhaust path. Restrictions or faults in these systems can raise exhaust temperatures, create cylinder imbalance, smoke, unstable running, or higher fuel use.
- Air-cooler fouling can reduce charge-air cooling and flow.
- Turbocharger contamination or damage can reduce air delivery.
- Injector wear can alter spray pattern and combustion quality.
- Fuel-treatment problems can affect fuel cleanliness, viscosity control, or water content.
- Exhaust valve leakage and poor compression can reduce cylinder performance.
These symptoms overlap, so maintenance decisions should use the engine maker’s limits, trend monitoring, and inspection evidence rather than one parameter alone.
🌡️ Use Cylinder and Exhaust Trends Carefully
Cylinder pressure measurements, exhaust temperatures, scavenge pressure, turbocharger speed, and smoke observations help identify imbalance. A cylinder consistently behaving differently from its neighbors deserves attention, especially when the deviation is persistent.
But comparison must account for sensor condition and operating load. A temperature sensor fault, changing ambient conditions, or load transients can create apparent differences. Confirm questionable readings before adjusting fuel racks or replacing expensive components.
🧊 Account for Cooling and Ambient Conditions
Seawater temperature, air temperature, humidity, and fouling in heat exchangers influence cooling margins and charge-air conditions. A vessel operating in warm water may not achieve the same temperatures or air density seen in colder service.
These environmental effects do not excuse abnormal trends, but they prevent incorrect comparisons. Record ambient and cooling-water conditions when reviewing engine performance across seasons or trading areas.
🎛️ Consider Engine Loading and Slow Steaming
Large marine engines are designed to operate within defined load ranges. Prolonged low-load operation can change combustion quality, turbocharger response, fouling behavior, and maintenance needs, depending on engine type and arrangement.
Slow steaming can reduce total voyage fuel use because resistance falls sharply with speed. Yet running too slowly without following maker guidance may create operational drawbacks. The efficient voyage speed is therefore an operational decision, not simply the lowest possible rpm.
🧭 Review Autopilot, Rudder, and Steering Losses
A ship that constantly hunts around its course uses rudder angle to correct yaw. The rudder then produces side force and drag, while the propeller must supply more thrust. This effect can be significant in rough weather or with poorly tuned steering settings.
Review heading traces, average rudder activity, autopilot settings, gyro performance, steering gear response, and hull motions. A more stable track can reduce unnecessary resistance, provided safety and maneuvering requirements remain fully satisfied.
⚡ Include Electrical and Auxiliary Demand
Not every extra tonne of fuel is linked to the main engine. Hotel load, cargo equipment, refrigeration, pumps, boilers, deck machinery, and generator operating strategy can all alter total fuel figures.
Separate main-engine fuel from auxiliary and boiler consumption when possible. This prevents a cargo-related electrical increase from being misdiagnosed as reduced propulsive efficiency.
🧾 Compare Symptoms Before Choosing a Cause
| Observed pattern | Likely area to examine | Useful confirming evidence |
|---|---|---|
| More shaft power at similar speed through water | Hull, propeller, appendages, trim | Underwater inspection and normalized power-speed trend |
| More fuel at similar shaft power | Engine efficiency, fuel data, auxiliaries | Specific fuel trend, cylinder data, fuel reconciliation |
| Higher vibration with performance loss | Propeller, shaft line, cavitation | Underwater findings, vibration pattern, shaft monitoring |
| Reduced available load or rising temperatures | Air, cooling, exhaust, sea-water systems | Pressure, temperature, cooler, and sea-chest checks |
This table is a starting point, not a diagnosis. Several defects can occur at once, and a fouled hull can mask an emerging engine issue.
🧩 Avoid the Single-Cause Trap
Excess fuel consumption often has more than one contributor. For example, a vessel may have gradual hull fouling while an air cooler also becomes dirty and the route experiences a seasonal current change.
Trying to assign every extra kilogram of fuel to one cause can create false confidence. Rank contributors by evidence, expected impact, safety implication, cost, and practicality of correction.
🛠️ Build a Step-by-Step Troubleshooting Plan
- Confirm fuel, speed, draft, and power data are credible.
- Select comparable operating periods and normalize for route and weather.
- Identify whether the primary shift is in power demand or fuel per unit power.
- Review recent maintenance, docking, idle periods, damage reports, and fuel changes.
- Inspect the most likely external and internal systems safely.
- Correct verified defects, then measure the response under comparable conditions.
Start with low-cost verification before invasive work, but do not delay action where abnormal temperatures, vibration, leakage, or machinery alarms indicate a reliability risk.
📅 Turn Findings Into a Maintenance Strategy
The best result is not a one-time recovery after a fuel spike. It is a repeatable process that links hull condition, propeller condition, engine trends, and operating profile to planned maintenance.
Maintain a performance record after dry dock, underwater cleaning, propeller repair, cooler cleaning, injector work, and major engine overhaul. Over time, this establishes vessel-specific evidence for when an intervention is worthwhile.
🤝 Coordinate Deck and Engine Departments
Fuel performance crosses departmental boundaries. Deck teams see route, weather, ballast, trim, speed, and steering behavior. Engine teams see fuel treatment, machinery load, temperatures, pressures, vibration, and maintenance condition.
Shared reporting prevents narrow conclusions. A useful review asks what changed on the ship and around the ship, rather than treating consumption as an engine-room number alone.
🧠 Use Digital Tools as Aids, Not Oracles
Performance software, shaft-power meters, condition monitoring, and automated noon-report systems can reveal patterns that manual review misses. They are especially helpful for detecting gradual deterioration across many voyages.
Yet a model is only as reliable as its inputs and assumptions. Sensor validation, clear data ownership, and engineering judgment remain essential when software identifies an apparent loss.
✅ The Core Principle: Trace the Loss Through the System
Effective fuel troubleshooting follows energy from tank to wake. First establish trustworthy operating data. Then determine whether the vessel needs more power to move through water, or whether the engine needs more fuel to provide the same power.
That distinction directs attention. Increased power demand points toward resistance and propulsion efficiency; increased fuel per unit power points toward engine condition, fuel handling, or uncounted loads. Real cases may involve both, so evidence must be reviewed as a connected system.
Corrective work is strongest when it is measured. A clean hull, repaired propeller, tuned engine, or improved operating practice should be followed by comparable performance checks, not assumed to have delivered a benefit.
Excessive ship fuel consumption is best solved by tracing a verified performance change through the entire propulsion chain, rather than guessing from the fuel figure alone. That habit improves efficiency, reliability, maintenance planning, and communication across the vessel. 🚢⚙️🌊