
A cargo vessel arrives alongside a berth after a long passage. Before cargo operations begin, the crew read the draft marks, check the water density, and compare the result with the loading plan. Those simple-looking numbers determine whether the ship is carrying the intended cargo mass, whether it remains within its permitted draft, and whether its stability calculations are still valid.
The same principle is at work when a naval architect estimates a vessel’s weight, when a surveyor performs a draft survey, or when a small boat seems to sit lower in a freshwater marina than it did at sea. A floating ship is, in effect, a weighing instrument built from steel.
The underlying physics is straightforward: a ship displaces a volume of water whose weight equals the ship’s total weight. Applying that statement accurately is harder. Draft, hull shape, trim, water density, wave action, tank contents, and reading errors all affect the final answer.
Understanding the formula behind displacement turns a set of draft marks into useful engineering information. It also explains why a few centimetres of immersion can represent many tonnes on a large vessel.
⚓ Displacement Is the Ship’s Actual Floating Weight
Displacement is the mass or weight of water pushed aside by a floating vessel. Because the vessel is floating in equilibrium, that displaced water has the same weight as the vessel at that moment.
Therefore, a ship’s displacement includes far more than its steel hull. It includes machinery, fuel, lubricating oil, freshwater, ballast water, stores, crew, passengers, cargo, and any other onboard mass.
In routine marine work, displacement is usually expressed in tonnes. Strictly speaking, mass and force are different quantities, but maritime practice commonly uses “tonnes displacement” to describe the vessel’s mass-equivalent floating weight.
🌊 Archimedes’ Principle in a Working Ship
The governing idea is Archimedes’ principle: a body immersed in a fluid experiences an upward buoyant force equal to the weight of the fluid it displaces. For a floating ship, buoyancy rises until it balances the vessel’s downward weight.
Add cargo and the ship must displace more water. It settles deeper, increasing draft and underwater hull volume. Remove cargo, consume fuel, or discharge ballast, and the vessel rises because less displaced volume is needed.
This is not a special property of ships. A person in a bath, a floating timber log, and a pontoon bridge all follow the same rule. Ships simply make the relationship measurable on a much larger scale.
📐 The Core Displacement Formula
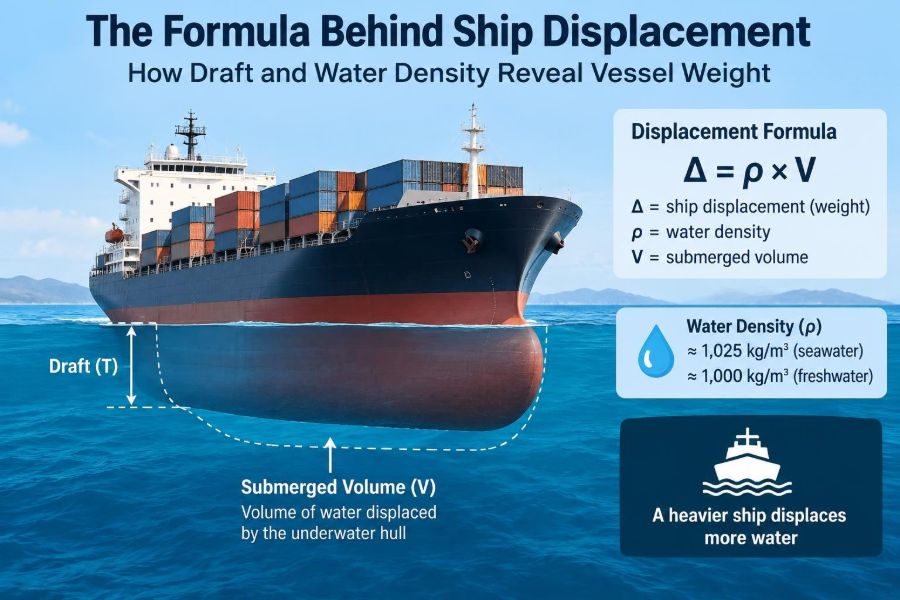
The basic relationship can be written as:
Displacement = Underwater volume × Water density
Using SI units, if underwater volume is measured in cubic metres and water density in tonnes per cubic metre, the answer is displacement in tonnes.
Δ = ∇ × ρ
Here, Δ is displacement, ∇ is displaced underwater volume, and ρ is water density. The formula is elegant, but the volume is rarely measured directly on board. Instead, it is obtained from draft readings and the ship’s hydrostatic data.
📏 Draft Is the Visible Clue
Draft is the vertical distance from a defined reference near the keel to the waterline. Draft marks are painted or welded near the bow, stern, and often amidships, allowing the crew or surveyor to observe how deep the ship sits.
A higher draft means more of the hull is submerged. On a vessel with a conventional displacement hull, this generally means greater displacement.
Draft marks do not directly state vessel weight. They indicate immersion. The ship’s hydrostatic tables or curves translate that immersion into displaced volume or displacement for the vessel’s known hull form.
🧭 Why Several Draft Readings Are Taken
A ship does not always float level from bow to stern. It may also bend slightly along its length. For that reason, a proper draft survey normally uses readings on both port and starboard sides at the bow, amidships, and stern.
Port and starboard readings are averaged at each position to reduce the effect of list, waves, or an imperfect individual observation. The resulting forward, midship, and aft mean drafts show the vessel’s overall floating attitude.
One draft mark alone can be misleading. A ship trimmed by the stern may have a deep aft draft but an average draft that corresponds to a materially different displacement.
↕️ Mean Draft and the Starting Estimate
A simple mean draft can be calculated from the forward and aft drafts, or from all available marks depending on the procedure and the hydrostatic reference used. It provides a first estimate of the vessel’s immersion.
However, hydrostatic data are often based on a particular reference condition, commonly an even-keel draft or a specified longitudinal position. The observed mean must therefore be used carefully, especially where trim is significant.
For preliminary planning, a mean draft is often adequate. For commercial draft surveys, loading verification, or close under-keel-clearance decisions, corrections become essential.
⚖️ Hydrostatic Tables Convert Draft into Displacement
Every ship has hydrostatic particulars developed from its hull geometry. These may appear as printed tables, stability-booklet pages, loading-computer data, or curves.
At each listed draft, the data commonly provide displacement, underwater volume, waterplane area, tonnes per centimetre immersion, longitudinal centre of buoyancy, and other stability-related values. Values between table entries are obtained by interpolation.
Hydrostatics are specific to that vessel’s hull. A draft of 8.00 m on one ship cannot be assumed to represent the same displacement as 8.00 m on another ship.
🗺️ The Hydrostatic Reference Condition Matters
Before using a hydrostatic table, check its basis. It may state whether drafts are measured from moulded baseline, keel underside, or another reference. Draft marks themselves may have a documented offset from the design baseline.
A mismatch between the observed draft reference and the table reference creates a systematic error. It can be small in length but substantial in tonnes, particularly on vessels with a large waterplane area.
The stability booklet, approved plans, and ship-specific survey documentation should identify the required corrections. Never assume that painted draft figures and tabulated drafts share exactly the same datum.
🧂 Seawater Density Is Not a Fixed Number
Many hydrostatic tables are calculated for standard seawater with a density near 1.025 tonnes per cubic metre. Actual harbour water may differ because of salinity, river inflow, temperature, tides, or local mixing.
A ship floating in less-dense water must displace a larger volume to support the same weight. It will therefore sink slightly deeper. In denser water, it rises slightly for the same onboard mass.
This is why water density is not a minor detail in displacement work. The hull volume inferred from draft must be paired with the density of the water actually supporting the ship.
💧 Freshwater, Brackish Water, and Seawater
Freshwater has a density close to 1.000 tonnes per cubic metre, while standard seawater is commonly taken as about 1.025 tonnes per cubic metre for ship calculations. Brackish water lies between them, but its exact density should be measured rather than guessed.
| Water condition | Typical density used for illustration | Effect on a ship of unchanged weight |
|---|---|---|
| Freshwater | About 1.000 t/m³ | Ship sits deeper |
| Brackish water | Between freshwater and seawater | Intermediate draft |
| Standard seawater | About 1.025 t/m³ | Ship floats higher than in freshwater |
These figures are useful reference values, not substitutes for a tested local sample. A port near a river mouth can have density changes across a berth or with the tide.
🧪 Measuring Dock Water Density
Water density is commonly determined by taking representative samples near the vessel and testing them with a calibrated hydrometer or density meter. Sampling depth, location, and timing matter when water is layered or moving.
For a serious draft survey, one sample taken beside the accommodation ladder may not represent the whole dock. Survey practice may require samples from forward, amidships, and aft positions, with attention to the water surrounding the hull.
The result should be recorded with the method and temperature basis required by the instrument or procedure. Density readings are only as reliable as the sampling and calibration behind them.
🔢 Density Correction in Practical Terms
Suppose hydrostatic tables give a displacement corresponding to standard seawater, but the vessel is floating in water of lower density. The observed draft represents a larger submerged volume than it would in standard seawater, while the actual mass remains unchanged.
Survey calculations apply a density correction to align the tabulated displacement with the measured dock-water condition. The precise method depends on the hydrostatic data supplied and the survey procedure used.
The key idea is simple: do not treat displacement read from standard-seawater tables as automatically equal to actual vessel displacement in non-standard water. Confirm which density the source data assume.
📊 Tonnes per Centimetre Immersion
Tonnes per centimetre immersion, usually abbreviated TPC, states the approximate mass required to change a ship’s mean draft by one centimetre at a particular draft.
If a vessel has a TPC of 25 tonnes per centimetre, adding about 25 tonnes near the relevant condition would increase its mean draft by roughly one centimetre. The word “roughly” matters because TPC varies with draft, water density, trim, and loading distribution.
TPC is extremely useful for quick loading estimates. It is also a warning against casual draft reading: on a large ship, a 2 cm error can correspond to dozens of tonnes.
📈 Waterplane Area Explains TPC
The waterplane area is the horizontal area enclosed by the waterline. A vessel with a broad, nearly rectangular waterplane needs more volume to sink one centimetre than a slender vessel at the same draft.
In simplified form, an added centimetre of draft creates an added underwater volume equal to waterplane area multiplied by 0.01 m. Multiplying that volume by water density gives the approximate TPC.
TPC ≈ Waterplane area × 0.01 × Water density
This relationship explains why TPC is not constant throughout a ship’s draft range. Hull sides may flare outward, narrow inward, or pass through changes in geometry.
🚢 Lightship, Deadweight, and Loaded Displacement
Lightship displacement is the vessel’s weight in a defined light condition, generally including the hull, machinery, and permanent equipment but excluding consumable and variable loads specified by the relevant definition.
Deadweight is the carrying capacity between lightship and a specified loaded condition. It includes cargo as well as fuel, ballast, freshwater, stores, crew, and passengers where applicable.
Loaded displacement is the total floating weight at that condition. In broad terms:
Loaded displacement = Lightship displacement + Deadweight
Definitions must be checked in the vessel’s documents. Operational calculations can go wrong when a quoted “deadweight” is treated as if it means cargo capacity alone.
📦 Cargo Weight Is Only One Part of the Calculation
A draft survey is often used to estimate cargo loaded or discharged. It does not measure cargo directly. It measures a change in the vessel’s total displacement, then accounts for changes in liquids, stores, and other weights.
For example, a ship may load cargo while also consuming fuel, taking on ballast, receiving freshwater, or landing waste. The displacement difference must be adjusted for those documented changes before it can represent cargo mass.
This is why good tank soundings, tank calibrations, and operational records are integral to an accurate cargo survey.
🧾 A Simplified Draft-Survey Workflow
A professional draft survey follows an agreed procedure and vessel-specific information. At a high level, the logic is:
- Read draft marks on both sides at the required positions.
- Average port and starboard readings and determine the vessel’s trim.
- Correct drafts for mark offsets and other applicable geometric factors.
- Use hydrostatic data to obtain displacement at the corrected condition.
- Apply density and trim-related corrections where required.
- Determine onboard liquid and variable-weight changes.
- Calculate the cargo quantity from the corrected displacement difference.
This sequence looks linear, but each step has assumptions. Surveyors must also assess weather, mooring conditions, hull accessibility, and the quality of the ship’s records.
🛠️ Trim Corrections Account for a Sloping Waterline
Trim is the difference between the vessel’s forward and aft drafts. A ship trimmed by the stern has a waterline that is not parallel to the baseline assumed by many basic hydrostatic entries.
The displacement associated with a given observed mean draft may differ from the even-keel tabulated value. Trim corrections account for the actual longitudinal attitude and for the relation between the draft-reading positions and the hydrostatic reference point.
These corrections are ship-specific. They should come from approved hydrostatic information or established survey calculation sheets, not from a generic rule of thumb.
🏗️ Hogging and Sagging Can Distort Draft Readings
A ship’s hull behaves like a long beam. Waves, cargo distribution, ballast condition, and structural loading can make it curve slightly. Hogging means the midship area is relatively high; sagging means it is relatively low.
When this happens, forward, midship, and aft draft readings may not fit the ideal straight-line assumption. A simple average can then misrepresent the effective mean draft.
Some survey methods include a deflection correction based on the relationship among the three sets of readings. Whether and how it should be applied depends on the vessel’s procedure and the condition observed.
🌬️ Weather and Water Movement Affect Accuracy
Draft marks are easiest to read in calm, clear water. Swell, passing traffic, wind chop, glare, rain, floating debris, and poor access can make the waterline difficult to judge.
Observers may need to take repeated readings over several wave cycles rather than selecting one convenient high or low point. Safe access is equally important: no quantity result justifies unsafe work near a ship’s side or under a berth.
A report should record conditions that limit confidence. Reporting uncertainty is better engineering than presenting a falsely precise number.
👀 Common Errors When Reading Draft Marks
Many displacement errors begin with an apparently small observation mistake. Typical causes include:
- Reading the top rather than the bottom of a draft numeral, or using the wrong unit system.
- Viewing at an angle, which introduces parallax error.
- Confusing a temporary stain, weld line, or marine growth with the waterline.
- Ignoring list and using only one side of the vessel.
- Reading in moving water without allowing for wave variation.
- Using marks whose positional correction has not been checked.
Good practice uses independent checks. If the figures imply an improbable trim, list, or cargo change, the first response should be to revisit the observations and assumptions.
🛢️ Tank Soundings Need Their Own Corrections
Liquid weights are often derived from tank soundings or ullages. A sounding is the measured liquid depth; an ullage is the empty space from a reference point down to the liquid surface.
Tank tables convert those readings into volume, but the conversion can depend on trim, list, and tank geometry. The volume must then be multiplied by the appropriate liquid density to obtain mass.
Fuel oil temperature deserves attention because it changes volume. Bunker quantities may be reported using a standard reference temperature, while the tank contains fuel at an observed temperature. Mixing these bases carelessly causes avoidable discrepancies.
🧠 A Hypothetical Calculation
Consider a hypothetical vessel whose corrected hydrostatic data indicate an underwater volume of 18,000 m³ at the observed floating condition. If the dock-water density is measured as 1.018 t/m³, the displacement is:
Displacement = 18,000 m³ × 1.018 t/m³
Displacement = 18,324 t
Now imagine that after cargo operations the corrected displaced volume is 19,200 m³ and density is unchanged. The final displacement is 19,545.6 t. The gross displacement increase is 1,221.6 t.
That increase is not automatically the cargo loaded. If the ship consumed 20 t of fuel and took on 10 t of freshwater, the cargo calculation must account for both changes. This example is simplified; actual surveys may require further trim, deflection, and tank corrections.
🧮 Interpolation Between Hydrostatic Entries
Hydrostatic tables may list values every 0.10 m of draft, while an observed corrected draft might be 7.46 m. In a smooth part of the curve, linear interpolation between the 7.40 m and 7.50 m entries is commonly used.
For instance, if displacement rises by 300 t across that 0.10 m interval, a draft 0.06 m above the lower entry represents approximately 60% of the change, or 180 t above the lower displacement.
Interpolation is an approximation based on local linearity. Use the supplied curves or finer-grained digital data where available, and avoid extending calculations outside the documented draft range.
🚧 Displacement Is Not the Same as Draft Limit
Knowing displacement does not by itself establish whether a ship may safely or legally sail. Draft limits can arise from load-line markings, port restrictions, channel depth, tidal height, squat, manoeuvring margin, hull fouling, and required under-keel clearance.
Two vessels at the same displacement can have different drafts because their hull forms differ. Even one vessel at the same displacement can have different forward and aft drafts depending on cargo distribution and ballast.
Displacement describes total supported weight. Safe operation requires considering where that weight is placed as well as how much there is.
🧭 The Link Between Displacement and Stability
Displacement is central to stability calculations because it establishes the total weight acting through the vessel’s centre of gravity. Cargo and ballast distribution then determine the position of that centre.
As loading changes, draft changes, underwater shape changes, and the centre of buoyancy moves. These effects influence righting ability, trim, propeller immersion, steering, and structural loading.
A draft figure without a loading plan is therefore incomplete information. The vessel may have an acceptable total displacement but an unsafe list, excessive trim, or unsuitable stability condition.
🧱 Hull Form Determines the Draft-to-Weight Relationship
A full-form bulk carrier, a container ship, a naval vessel, and a high-speed craft can all show very different displacement behaviour. Their waterplane areas, hull flare, chines, and underwater volume distribution are not alike.
Near its design draft, a boxy vessel may gain substantial displacement for a small increase in draft. A finer hull may require a greater immersion change for the same added weight.
This is why engineers rely on hydrostatic curves rather than a universal “tonnes per centimetre” value. Hull geometry is the bridge between observed draft and vessel weight.
🔍 When Draft Surveys Are Most Useful
Draft surveys are especially useful when bulk cargo is loaded or discharged and direct weighing is impractical. They can also support voyage planning, ballast monitoring, discrepancy investigation, and condition checks during operations.
They are less straightforward where cargo changes are small relative to the ship’s displacement, where weather prevents reliable readings, or where tank information is poor. In such cases, the resulting uncertainty may be large compared with the quantity being assessed.
A draft survey should be treated as a carefully controlled engineering estimate, not as a magical measurement that overrides all other records.
✅ Practical Checks Before Trusting a Result
A credible displacement result should make physical and operational sense. Check that the calculated displacement corresponds reasonably with the observed draft range, vessel condition, and loading sequence.
- Confirm the hydrostatic table’s density basis and draft datum.
- Compare forward, midship, and aft readings for unusual trim or deflection.
- Check that tank records include density, temperature, and sounding corrections where needed.
- Review whether ballast, consumables, stores, or waste changed during the operation.
- Record weather and water conditions that may affect reading quality.
- Retain calculation sheets so another competent person can review the logic.
These checks do not eliminate uncertainty, but they make hidden assumptions visible.
⚠️ False Precision Is a Common Reporting Risk
It is tempting to report displacement to several decimal places because a spreadsheet produces them. Yet draft marks may only be readable to a limited resolution, water may be moving, and density samples may not perfectly represent the full hull length.
Results should be rounded in a manner consistent with the quality of the observations and the purpose of the calculation. A value reported as 18,324.63 t can imply a certainty that field conditions do not support.
Engineering accuracy is not just calculation detail; it is honest recognition of measurement limitations.
📚 Building Skill with Real Ship Data
Students can learn the logic using a simplified hydrostatic table and a hypothetical set of drafts. Start by calculating port-starboard averages, then determine trim, interpolate displacement, and apply a stated density correction.
Working professionals should become familiar with the vessel’s own stability booklet, loading manual, draft-mark offsets, tank tables, and onboard loading computer. These documents are more valuable than memorising generic formulas.
When results affect cargo quantity, seaworthiness, or contractual matters, use the governing company procedures and involve qualified personnel. The basic formula remains the same, but the required level of control changes with the consequence of error.
🌟 The Core Principle Behind Every Floating Ship
A ship floats when the water it displaces weighs exactly as much as the ship and everything aboard it. Draft reveals how deeply the hull has entered the water; hull hydrostatics reveal the corresponding volume; water density converts that volume into displacement.
From there, careful practice handles the real-world complications: trim, list, hull deflection, draft-mark reference, variable density, tank quantities, and measurement uncertainty. None of these replaces Archimedes’ principle; they ensure it is applied to the ship that is actually floating at the berth.
The practical chain is worth remembering: read the draft accurately, establish the correct underwater volume, use the actual water density, and account for all changing onboard weights.
Ship displacement is the measurable meeting point of buoyancy, hull geometry, and operational loading—and accurate results depend on respecting all three. ⚓🌊📐