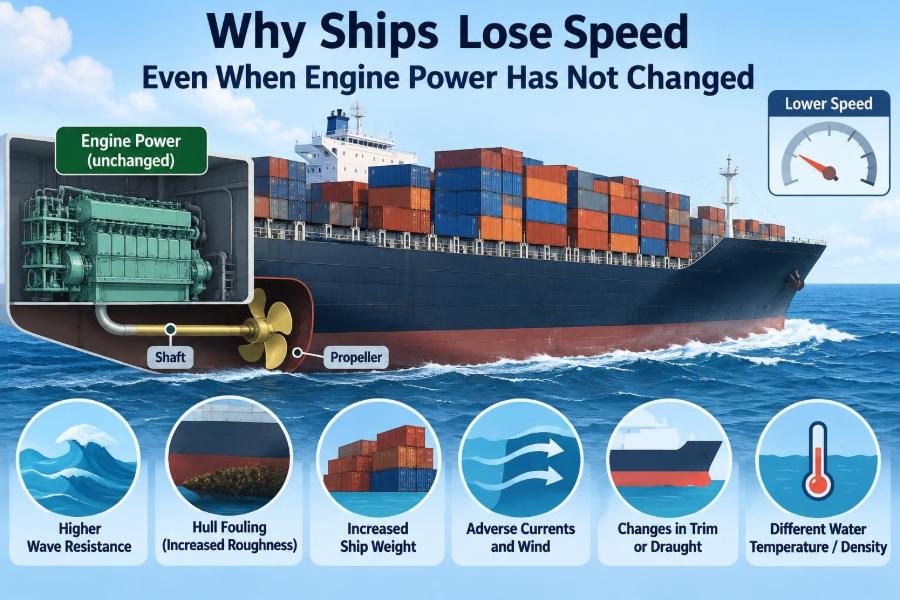

A ship leaves port with the main engine running at a familiar load and a familiar rpm. The watchkeeper expects the usual service speed, yet the GPS speed is lower than planned. Nothing obvious has failed: fuel racks, turbocharger, cooling temperatures, and shaft speed all appear normal.
This is a common operational puzzle. It can affect fuel planning, arrival times, charter performance, emissions, and the workload of everyone from the bridge team to the engine department.
The key is that engine power is only one side of the propulsion equation. A ship moves ahead when the propeller can turn delivered shaft power into useful thrust, and when that thrust exceeds the resistance of the water, wind, waves, and the ship itself.
When speed falls at unchanged power, the vessel has not necessarily lost engine performance. More often, it is facing more resistance, less propeller efficiency, or misleading operating data. Understanding which one is responsible turns a vague complaint—“the ship is slow”—into an engineering problem that can be investigated.
⚖️ The Basic Balance Between Power and Resistance
At steady speed, propeller thrust balances total resistance. Total resistance includes the friction of water along the hull, wave-making resistance, air resistance, steering resistance, and the effects of wind and sea state.
Power is the rate at which work is done. If resistance rises while shaft power remains constant, the ship must settle at a lower speed where the available thrust and the increased resistance balance again.
A useful everyday analogy is cycling into a headwind. Your legs may produce the same effort, but your road speed falls because the opposing force has grown.
📈 Why Small Speed Changes Can Require Large Power Changes
For a displacement ship operating in ordinary conditions, the power needed to increase speed tends to rise steeply. The exact relationship varies with hull form, draft, trim, and operating condition, but it is often approximated over a limited range as varying roughly with the cube of speed.
That means a modest speed loss can represent a significant increase in resistance or decrease in propulsion efficiency. Conversely, recovering a small amount of speed may require much more fuel than expected if the ship is already near its economical operating limit.
This is why speed should never be interpreted as a direct, linear indicator of engine output.
🧭 Speed Through Water Is Not Speed Over Ground
GPS normally reports speed over ground (SOG): the ship’s movement relative to the seabed. A speed log aims to report speed through water (STW): movement relative to the surrounding water.
A current can dramatically change SOG without changing hull resistance very much. A vessel making 14 knots through the water may show less speed over ground in an adverse current and more in a favorable current.
Before suspecting the machinery plant, compare reliable STW, SOG, course, current information, and conditions over a sufficiently long period. A short observation during a tidal stream is rarely a valid performance assessment.
🌊 Adverse Current Can Mimic a Performance Problem
Current is especially deceptive because it may be invisible on the sea surface. In channels, river approaches, straits, and coastal routes, its direction and strength can vary with depth, tide, weather, and local geography.
An adverse current reduces passage speed over ground but does not necessarily mean the ship is consuming more power to move through the water. It is primarily a navigation and schedule issue, although route choice may create additional fuel consequences.
The practical question is simple: is the vessel slow relative to the water, or slow relative to the land? The corrective action differs completely.
🌬️ Wind Adds Air Resistance and Can Change Trim
Wind acts on the exposed area above the waterline: accommodation block, containers, deck cargo, cranes, masts, and the hull sides. Headwinds increase aerodynamic drag, while crosswinds may force a rudder angle that creates further underwater resistance.
On high-sided container ships, vehicle carriers, and offshore vessels, wind can be a major operational influence. Even when the air drag itself is moderate, the resulting leeway and steering corrections may reduce efficiency.
Wind also produces waves. In practice, separating pure wind resistance from wave effects is difficult outside controlled analysis, so voyage data should record both.
🌊 Waves Reduce Speed in More Than One Way
Head seas add resistance because the hull must continually climb and descend wave slopes, generate altered wave patterns, and accelerate surrounding water. Pitching and heaving also change the flow into the propeller.
In rough weather, speed loss may be deliberate. The master may reduce speed to limit slamming, green water on deck, propeller emergence, cargo movement, structural loads, or uncomfortable and unsafe motions.
A weather-related speed reduction is not evidence of poor machinery condition. It is often sound seamanship and a necessary protection of the ship, people, and cargo.
🪨 Added Resistance in Head Seas
Added resistance is the extra force required to maintain a given mean speed in waves compared with calm water. It depends on wave height, length, encounter angle, ship size, bow shape, loading condition, and speed.
Short steep waves can be particularly troublesome because the ship meets them frequently. Longer waves may produce larger motions, especially when their encounter period approaches a natural motion period of the vessel.
There is no single “wave correction” that fits every ship. Logged weather descriptions, wave direction, and observed motion are more useful than treating all rough-water days as equal.
🧱 Hull Fouling Raises Skin-Friction Resistance
The largest wetted surface of a ship is its hull, and water flowing along that surface creates frictional resistance. Marine growth, slime, algae, shell organisms, and coating roughness disturb the boundary layer—the thin region of water directly influenced by the hull surface.
Even a hull that looks only lightly discolored can develop enough roughness to affect fuel use and speed. The impact depends on vessel type, time since cleaning, trading pattern, coating condition, water temperature, and periods spent stationary.
Hull fouling is a classic cause of gradually worsening calm-water performance at otherwise comparable draft, trim, and engine condition.
🐚 Why Idle Time Often Makes Fouling Worse
When a ship is moving, water flow may discourage some organisms from establishing themselves. During long anchorage, lay-up, waiting time, or slow steaming, organisms have more opportunity to attach and grow.
Warm nutrient-rich waters can accelerate this process, but fouling can occur in many regions. A vessel trading regularly between ports may therefore show different performance trends than one continuously at sea.
Operational records should note extended idle periods. They often explain why a previously stable power-speed curve begins to drift.
🎨 Coating Condition Matters Beyond Appearance
Antifouling coatings are designed to control biological growth, but their effectiveness depends on coating selection, application quality, service profile, damage, and age. Mechanical abrasion, impact damage, and localized repairs can create rough areas.
A coating can also be visually intact yet no longer provide the same hydrodynamic surface. This does not mean every speed loss requires drydocking; it means coating condition belongs in the evidence gathered before making conclusions.
The engineering objective is a low-roughness hull over the full operating cycle, balanced against docking schedules, environmental requirements, and cleaning options.
🌀 Propeller Fouling Steals Thrust Directly
A propeller operates in a highly loaded flow field. Marine growth or surface roughness on its blades changes the flow, increases drag, and reduces the efficiency with which torque is converted into thrust.
Propeller fouling can be disproportionately influential because it acts at the final energy-conversion stage. A clean engine and a clean hull cannot fully compensate for a propeller whose blade surfaces are rough or contaminated.
Evidence may include worsening power-speed performance, changes in shaft torque or slip, and improvement after a confirmed propeller cleaning. Interpretation still requires care because weather and loading condition can hide the result.
🔧 Blade Damage and Surface Defects
Bent blade tips, edge damage, cavitation erosion, dents, and rope damage alter blade geometry. The consequences can include lost efficiency, vibration, noise, uneven loading, and increased risk of further damage.
Not every defect produces an obvious alarm. A ship can continue operating while quietly paying a fuel and speed penalty, especially if the damage is small but affects a sensitive part of the blade.
Underwater inspection should assess more than whether the propeller is present and turning. Blade condition, surface finish, hub area, and evidence of fishing gear or debris all matter.
💨 Cavitation Is Not Always a Fault, but It Can Be a Clue
Cavitation occurs when local pressure around a propeller blade falls low enough for vapor-filled cavities to form. Some cavitation can be expected in propeller operation, particularly at high load, but excessive or unstable cavitation wastes energy and may erode blade surfaces.
Heavy seas, poor inflow, damaged blades, excessive loading, and ventilation can worsen it. Operators may notice vibration, noise, fluctuating shaft load, or reduced effectiveness.
Because cavitation cannot be diagnosed reliably from one symptom alone, it should lead to a broader review of propeller loading, draft, trim, sea state, and underwater condition.
🌪️ Air Ventilation Can Interrupt Propeller Grip
Ventilation is the ingestion of air or exhaust gas into the propeller flow. Unlike cavitation, it involves external gas entering the blade region and can sharply reduce thrust.
It may occur when the stern rises in waves, when the propeller approaches the surface, or when heavy pitching causes intermittent emergence. A vessel may show racing—rapid rpm increase—as the propeller suddenly encounters less water resistance.
Reducing speed, changing heading where safe, adjusting ballast within approved limits, or altering trim can help restore steadier immersion. The correct response depends on the ship’s operating guidance and the prevailing conditions.
⚓ Draft Changes the Hull’s Resistance
A loaded ship displaces more water and has a larger wetted surface than the same ship in ballast. This generally increases frictional resistance, but the relationship is not as simple as “deeper always slower.” Hull shape, propeller immersion, trim, and wave-making behavior also change.
Performance comparisons are meaningful only when draft and displacement are known. Comparing a ballast trial with a loaded voyage can create a false impression of machinery deterioration.
For this reason, noon reports and performance logs should include reliable drafts, not merely a general label such as “loaded” or “ballast.”
📐 Trim Can Help or Hurt Efficiency
Trim is the difference between forward and aft draft. Changing trim alters the underwater shape presented to the flow, bow and stern wave systems, wetted area, and propeller immersion.
Some ships perform better with a modest trim by the stern; others may benefit from a different condition at particular drafts and speeds. The optimum is vessel-specific and may change with displacement and weather.
Trim optimization should be based on approved loading limits, stability, structural requirements, visibility, propeller immersion, and credible vessel data. A small fuel gain never justifies an unsafe or non-compliant loading condition.
🧳 Cargo and Deck Equipment Alter Windage
Container stacks, project cargo, deck machinery, open ramps, and temporary structures can increase windage—the exposed area acted on by wind. Their effect is most obvious in strong headwinds or crosswinds.
They may also shift the vessel’s wind center, increasing yaw and rudder demand. A route with frequent crosswinds can therefore produce different speed performance before and after a cargo change, even at similar displacement.
Performance analysis should include operational configuration, not only draft and engine figures.
🧭 Rudder Angle Creates Drag
A rudder works by creating a hydrodynamic force, but that force comes with drag. Constant small corrections, a poorly adjusted autopilot, strong cross-current, following seas, or a yaw-prone loading condition can all leave the rudder working more than expected.
Over-correcting is inefficient. If an autopilot responds too aggressively, it may create a repeated S-shaped track: the vessel remains near the intended course, but the rudder continuously consumes useful propulsive energy.
Course-keeping quality, average rudder angle, weather, and steering mode are valuable clues when speed falls without an obvious machinery explanation.
⚙️ Shaft Power Is Not the Same as Engine Indicated Power
Marine diesel engines generate power in the cylinders, but not all of it reaches the propeller. Mechanical losses occur in bearings, gears where fitted, shafting, and associated equipment.
Indicated power refers to power developed in the cylinders. Brake power is available at the engine output shaft. Delivered shaft power is the useful power transmitted toward the propeller, depending on the arrangement and measurement point.
When someone says “the engine power has not changed,” ask which power is being measured, how it is measured, and whether the figure is directly measured or estimated from fuel index, torque, or a control-system value.
📊 Constant RPM Does Not Guarantee Constant Power
On a fixed-pitch propeller, engine rpm and propeller rpm are closely linked, but power depends on torque as well as rotational speed. The basic relation is power equals torque multiplied by angular speed.
A constant rpm can therefore coexist with a change in torque and delivered power. Conversely, an engine governor may hold rpm while fuel delivery and thermal conditions change within operating limits.
Meaningful diagnosis needs rpm, torque or shaft power where available, fuel consumption, engine load, and relevant pressures and temperatures—not rpm alone.
🛢️ Fuel Quality and Engine Condition Can Reduce Available Margin
The engine may appear to maintain its commanded load while having less reserve for adverse conditions. Fuel properties, injector condition, turbocharger fouling, air cooler performance, exhaust back-pressure, scavenge air condition, and combustion quality can affect how efficiently power is produced.
These issues do not always cause an immediate speed loss in calm water. They may become visible when wind, waves, or hull fouling demand extra power that the machinery cannot safely provide.
Engine assessment must follow maker limits and onboard procedures. Chasing a lost knot by overloading the engine can create thermal, mechanical, and reliability risks.
🧪 Measurement Error Can Create a False Mystery
Speed logs can be affected by sensor fouling, calibration drift, aerated water, shallow water, and installation effects. Draft marks may be estimated inaccurately, weather observations may be inconsistent, and fuel figures may use different time bases.
GPS data can be excellent for position but cannot remove current effects. A single noon report combines many hours of changing route, weather, steering, and machinery conditions.
Before blaming the hull or main engine, verify the instruments and compare several independent data sources. A bad measurement can be more persuasive than a real fault because it looks precise.
🗺️ Shallow Water Changes the Flow Around the Ship
In shallow water, the hull has less space beneath it for water to flow. This can increase resistance and alter trim and sinkage, often called squat. Restricted channels can also introduce bank effects and stronger local currents.
The same engine setting may therefore produce a lower speed than it would in deep, open water. This is an environmental effect, not automatically a propulsion defect.
Safe navigation remains the priority. Depth, under-keel clearance, channel restrictions, and maneuvering requirements must govern speed decisions.
🛑 External Constraints May Intentionally Limit Speed
Traffic separation schemes, pilotage waters, emission-control operating practices, vibration limits, weather routing advice, charter instructions, and engine operating envelopes can all limit practical speed.
A ship may also be asked to arrive at a particular time, making just-in-time arrival more efficient than rushing and waiting at anchor. In these cases, lower speed is planned rather than lost.
Operational reporting should distinguish an intentional speed reduction from an inability to achieve expected speed. Combining them makes performance records less useful.
🧾 Build a Fair Power-Speed Comparison
A fair comparison uses data from similar operating conditions. Calm-water observations at comparable displacement, trim, shaft power, and water depth are far more useful than comparing unrelated voyage legs.
A practical record may include:
- date, position, route, water depth, and current estimate;
- STW, SOG, course, rpm, torque or shaft power, and fuel consumption;
- forward and aft drafts, displacement, trim, and ballast condition;
- wind direction and force, sea state, swell, and vessel motions;
- average rudder activity, steering mode, and any operational restrictions;
- hull and propeller cleaning dates, underwater inspections, and machinery maintenance.
Trends across many comparable observations matter more than any single report.
🔍 A Practical Troubleshooting Sequence
Start with navigation and environmental explanations: confirm whether the apparent loss is in SOG or STW, then review current, wind, waves, water depth, and route constraints. Next, check loading condition, trim, steering behavior, and reported machinery power.
If the trend remains in comparable calm-water conditions, investigate hull and propeller condition, followed by machinery performance and instrumentation accuracy. This order prevents expensive technical work based on a current-induced GPS difference.
Use specialists where needed. Underwater surveys, propeller assessment, engine performance analysis, and hull performance models each answer different questions and should be interpreted together.
🚫 Common Mistakes in Speed-Loss Investigations
The first mistake is treating a nominal engine load as proof that delivered propulsive power is unchanged. The second is using SOG alone as a measure of ship performance.
Other weak practices include comparing voyages at different drafts, ignoring sea state, assuming all fouling is visible from the deck, and drawing conclusions from a few hours of data. Another is demanding more power before checking whether weather, trim, steering, or a fouled propeller is the true constraint.
Good analysis is not about finding one convenient culprit. It is about removing alternative explanations in a disciplined order.
🧼 Cleaning Is Useful, but Timing Matters
Hull or propeller cleaning can restore performance when fouling is the cause, but the decision should consider expected benefit, coating compatibility, port availability, environmental controls, cost, and the vessel’s upcoming trading pattern.
Cleaning too late allows losses to accumulate; cleaning too often can damage coatings or create unnecessary cost. The best timing is normally based on a documented trend, inspection evidence, and the ship’s operational plan.
Post-cleaning performance should be evaluated under comparable conditions so the result is confirmed rather than assumed.
🌱 Efficiency Measures Work Best as a System
Speed performance improves most reliably when hull condition, propeller condition, trim, weather routing, steering practice, machinery maintenance, and data quality are managed together. A highly efficient propeller cannot overcome severe hull fouling, and a clean hull cannot cancel a persistent adverse current.
Digital monitoring can help reveal trends, but it does not replace engineering judgment. Data models require good inputs and must account for uncertainty in weather, loading, and sensor accuracy.
The goal is not always maximum speed. Often it is the safest and most economical speed that meets the voyage plan with the least avoidable energy loss.
✅ The Core Principle: Same Power Does Not Mean Same Speed
A ship’s speed is the visible result of a changing balance between delivered propeller power and total resistance. Water currents affect progress over ground; wind and waves add external resistance; hull, propeller, trim, and rudder behavior change how efficiently power becomes thrust.
When speed drops, the strongest investigation begins by defining the speed being discussed, collecting comparable operating data, and separating environmental effects from hull, propeller, machinery, and measurement issues.
This approach protects both fuel efficiency and equipment reliability. It also helps bridge and engine teams discuss the same problem using the same physical picture instead of relying on a single dashboard value.
A ship can lose speed at unchanged engine power because the sea, the hull, the propeller, or the data has changed—even when the engine has not. 🚢🌊⚙️