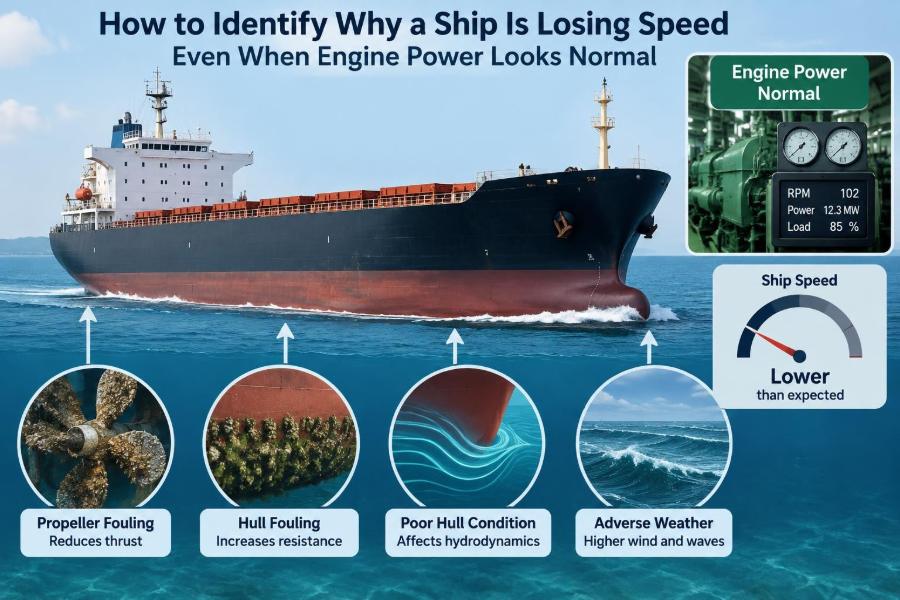

A vessel is on passage, the main engine appears to be carrying its usual load, fuel racks or injection indexes look familiar, and no alarm is active. Yet the GPS speed is lower than expected. The bridge asks for more speed, while the engine room sees no obvious loss of power.
This is a common and deceptively difficult problem. A ship does not move through still water on a test bed; it moves through wind, waves, current, changing drafts, fouled surfaces, and a propulsion train that may lose efficiency long before it produces a clear failure alarm.
The key question is not simply, “Is the engine normal?” It is: is the available engine power being converted into useful thrust, and is the hull meeting more resistance than expected?
A disciplined investigation prevents wasted fuel, unnecessary machinery intervention, and misleading reports to charterers or operators. It also helps engineers distinguish a genuine technical defect from ordinary environmental loss.
🧭 Start by Defining What “Losing Speed” Means
Speed can mean speed over ground (SOG), shown by GPS, or speed through water (STW), measured by a speed log. They are not interchangeable. A favorable current can raise SOG without improving the ship’s hydrodynamic performance; an adverse current can make a healthy vessel look slow.
First compare like with like: same loading condition, similar draft and trim, comparable weather, same engine setting, and preferably the same route direction. Without that baseline, a speed complaint is only an observation, not yet a diagnosis.
📍 Separate Speed Over Ground from Speed Through Water
Current is often the first explanation and sometimes the complete explanation. If SOG falls while STW remains close to normal, the vessel may simply be encountering an adverse set. If both fall, resistance or propulsion efficiency is more likely involved.
Check GPS, Doppler log if fitted, echo log where appropriate, and voyage data together. A log may have its own errors, especially in heavy seas, shallow water, aerated water, or at low speeds. Treat any one instrument as evidence, not absolute truth.
📈 Build a Fair Performance Baseline
A useful baseline is usually derived from sea-trial data, corrected performance curves, or well-documented previous voyages. The most useful relationship is often speed against shaft power, corrected as far as practical for displacement and environmental conditions.
Do not compare a ballast voyage directly with a fully loaded voyage. Increased displacement raises wetted surface area and may alter trim, immersion of the propeller, and hull resistance. Even two “loaded” passages can differ meaningfully if draft, cargo distribution, or fuel quantity differs.
🌊 Assess Wind, Waves, and Swell Before Blaming Machinery
Head wind and head seas add resistance. A ship pitching into a swell repeatedly accelerates and decelerates water around its hull, while wave impact and added resistance can reduce average speed even when mean engine power is unchanged.
Wave direction matters as much as wave height. Quartering seas may produce less direct resistance but can introduce yawing and rudder activity. A short, steep sea can be particularly unfavorable because the hull meets waves more frequently than it would in a longer swell.
🧭 Look at Current, Route, and Water Depth
A current changes SOG directly, but route geometry can also change the apparent result. A vessel following a curved track, avoiding weather, or making frequent course alterations may cover less effective distance toward its destination.
Shallow water deserves separate attention. As under-keel clearance reduces, flow around the hull changes and resistance can rise. Squat may increase draft and trim dynamically. The effect depends on hull form, speed, channel geometry, and clearance, so it should not be estimated from one universal rule.
⚓ Check Draft, Trim, and Displacement
Trim is not merely a stability or loading detail; it affects resistance and propeller inflow. A vessel trimmed excessively by the stern may have greater wetted area, while an unsuitable trim by the head may alter stern flow and propeller immersion.
There is no universally best trim. The efficient condition depends on hull form and loading. Compare actual drafts with the vessel’s approved guidance and past performance records, then investigate whether a loading change coincides with the speed reduction.
🧼 Inspect for Hull Fouling
Marine growth increases frictional resistance. Slime, weed, barnacles, and tube worms disturb the smooth boundary layer of water flowing along the hull. The engine can deliver normal power, but more of that power is consumed overcoming drag.
Fouling may develop gradually, making it hard to notice from daily figures. Risk rises during long idle periods, slow steaming, warm-water trading, and extended anchorage. A sudden performance decline after an anchorage can point to weed or other localized growth, but diver or dry-dock evidence is needed before reaching a firm conclusion.
🛞 Consider Propeller Fouling and Damage
A propeller is highly sensitive to surface condition. Rope, fishing line, plastic, netting, or marine growth can disturb flow and reduce thrust. Damage to blade edges, bending, pitting, or missing material can produce loss of efficiency and sometimes vibration.
Compare shaft rpm, power, vibration trends, and any unusual stern-tube or shafting observations. An underwater inspection is often the decisive step when performance loss follows a suspected contact, fishing-ground transit, or prolonged anchorage.
💨 Understand the Difference Between Power and Thrust
Engine power is the rate at which the engine supplies energy to the shaft. Thrust is the force the propeller produces to push the ship ahead. Between them sit shaft losses, gearbox losses where fitted, propeller efficiency, and the quality of water entering the propeller.
Think of a cyclist pedaling with normal effort on a muddy track. The legs may be producing the same power, but less of it becomes forward speed. A normal engine indication therefore does not prove normal propulsion performance.
🔄 Compare Shaft RPM, Torque, and Power Carefully
For a fixed-pitch propeller, absorbed power changes strongly with rpm under similar conditions. A simplified propeller-law relationship is often used operationally: power varies approximately with the cube of shaft speed. It is a useful trend tool, not a substitute for the vessel’s approved operating limits.
If rpm is normal but speed is down, investigate added resistance or reduced propeller efficiency. If rpm is low at a command that normally gives higher rpm, investigate engine output, governor behavior, fuel limitation, shaftline issues, or a controllable-pitch system where fitted.
🎛️ Treat Controllable-Pitch Propellers as a Separate Case
With a controllable-pitch propeller (CPP), shaft rpm alone does not describe propulsion demand. Blade pitch, rpm, hydraulic oil pressure, feedback position, control mode, and actual versus commanded pitch must all be checked.
A pitch feedback fault can make the displayed position misleading. Hydraulic leakage, control-valve problems, pitch limitation, or a mismatch between bridge command and hub position may reduce thrust while the engine and shaft seem healthy. Follow the maker’s procedures; CPP diagnosis can involve high-pressure hydraulic systems and interlocks.
🫧 Recognize Cavitation and Ventilation
Cavitation occurs when local pressure around a propeller blade falls enough for vapor cavities to form and collapse. It can reduce efficiency, create noise and vibration, and contribute to blade erosion over time. Ventilation is different: air or exhaust gas is drawn into the propeller stream.
Heavy pitching, inadequate immersion, disturbed stern flow, damaged blades, or excessive loading can contribute. A crew may notice fluctuating rpm, a change in vibration, or a “racing” tendency in rough weather. Conditions can be transient, so correlate observations with sea state and heading.
🌬️ Check Air Intake, Scavenge Air, and Turbocharger Condition
“Normal power” should be verified, not assumed from one display. Restricted air filters, fouled turbocharger components, air-side leakage, or scavenge-air problems can limit combustion quality and prevent the engine from achieving its expected output under load.
Review scavenge pressure, charge-air temperature, turbocharger rpm where available, exhaust temperatures, and smoke condition against the engine’s normal trend. A gradual deterioration may remain within alarm limits while still affecting fuel efficiency and available margin.
🔥 Review Fuel Quality and Fuel-System Behavior
Poor atomization, uneven injection, incorrect fuel temperature or viscosity, clogged filters, and fuel contamination can affect combustion. On electronically controlled engines, sensor and actuator performance also influences how consistently cylinders contribute.
Do not diagnose fuel quality from speed alone. Look for supporting evidence: uneven exhaust temperatures, increased smoke, unstable load, unusual filter differential pressure, or a change following bunkering or fuel changeover. Fuel sampling and laboratory analysis may be necessary when contamination is suspected.
🌡️ Use Exhaust Temperatures as Clues, Not Verdicts
Exhaust temperature patterns can reveal imbalance. One cylinder significantly different from its established trend may indicate injector, valve, compression, or combustion issues. A broad rise across all cylinders can suggest higher load, poor air supply, or changed ambient conditions.
However, sensor accuracy and probe location matter. A single high reading could be instrumentation error. Confirm with trends, cross-checks, and approved diagnostic procedures before adjusting fuel or opening machinery.
🧯 Confirm the Engine Is Not Quietly Derated
Modern engines may have protective load limitations associated with exhaust temperature, scavenge pressure, turbocharger condition, fuel mode, ambient air, or other monitored parameters. The engine may appear to answer commands while being held below its expected torque or power capability.
Check active limitation messages, historical events, control-system logs, and the actual permissible load. A derate may be appropriate protection, not a fault to bypass. Removing a limitation without finding its cause can turn a performance issue into machinery damage.
⚙️ Examine Shaftline, Bearings, and Gearbox Losses
Mechanical losses between engine and propeller are usually small in a healthy installation, but abnormal bearing temperature, inadequate lubrication, misalignment, brake drag, or gearbox problems can consume power and threaten reliability.
Watch for rising bearing temperatures, metallic debris in oil, abnormal vibration, unusual noise, or changes in lube-oil pressure. These symptoms require careful escalation because continued operation may damage shafting or gears. Never rely on speed loss alone to declare a shaftline problem.
🧲 Do Not Ignore Steering Drag and Rudder Angle
A rudder held away from midships acts like a brake. Autopilot settings, wind, swell, poor gyro input, steering gear response, hull asymmetry, or track-control behavior can cause frequent corrective rudder movements and added resistance.
Review rudder-angle history, not just a momentary display. A ship that is constantly hunting several degrees each side of midships may consume noticeably more energy than one holding a steady course. Safe navigation always comes first; the objective is to improve control tuning, not to reduce necessary steering action.
🧰 Review Auxiliary Loads and Power-Take-Off Arrangements
On some ships, a shaft generator or power-take-off (PTO) arrangement changes the power available for propulsion. Electrical demand, PTO/PTH operating mode, and generator loading can influence shaft power balance.
Verify the propulsion configuration at the time of the speed loss. This is especially relevant after a change in operating mode, large reefer load, cargo pump operation, or a switch between shaft and auxiliary generation. The exact impact depends on the plant design.
📡 Validate the Sensors Before Diagnosing the Ship
A misleading rpm signal, faulty torque meter, incorrect draft input, inaccurate fuel-flow meter, or speed-log error can create a convincing but false performance story. Instrument drift is particularly dangerous when it develops slowly and no single value looks impossible.
Cross-check independent sources. Compare bridge and engine-room rpm displays, confirm draft readings against marks where practical, review manual sounding and consumption records, and compare log data with GPS and voyage observations. Good diagnosis begins with trustworthy measurements.
🗂️ Use Trends Instead of Single Snapshots
A one-hour observation in rough weather rarely identifies root cause. Daily noon reports, high-frequency data, weather records, shaft power, rpm, drafts, trim, fuel consumption, and maintenance history reveal whether the change was sudden, gradual, or condition-dependent.
A gradual gap between expected and actual speed suggests fouling or slow machinery deterioration. An abrupt change after an event suggests damage, entanglement, a control issue, or a changed operating configuration. Pattern recognition narrows the inspection plan.
📊 Create a Simple Diagnostic Comparison
A compact comparison prevents teams from focusing on the first plausible cause. Record conditions against a known good passage or model point.
| Observation | What it may suggest | Useful next check |
|---|---|---|
| SOG down, STW normal | Adverse current or route effect | Current and track data |
| STW down, rpm and power normal | Hull/propeller resistance or weather | Weather correction, underwater inspection |
| RPM low for demand | Engine, control, or propulsion limitation | Load limits, fuel, air, CPP status |
| Speed loss with vibration | Propeller damage, fouling, cavitation, shaft issue | Vibration trend and inspection |
| Speed loss after anchorage | Fouling or entanglement | Hull and propeller survey |
🔍 Follow an Efficient Investigation Sequence
Start with checks that are safe, low-cost, and capable of ruling out major misconceptions. Escalate only when the evidence supports it.
- Confirm SOG, STW, current, weather, depth, draft, trim, and route.
- Compare actual rpm, torque or shaft power, pitch where applicable, and engine load limits.
- Review trends in exhaust temperatures, scavenge air, turbocharger behavior, fuel use, vibration, and rudder activity.
- Check configuration changes: PTO, generators, autopilot mode, fuel changeover, and ballast condition.
- Arrange underwater inspection or specialist support when hull, propeller, or shaftline evidence remains likely.
🧑✈️ Coordinate Bridge and Engine Room Observations
Speed loss crosses departmental boundaries. The bridge has the best view of track, weather, steering behavior, and navigational constraints. The engine department sees power production, machinery trends, fuel condition, and alarms.
A useful report states conditions and observations without assigning blame: “At comparable draft, rpm, and shaft power, STW is lower; adverse current is not sufficient to explain SOG loss; rudder activity is elevated; underwater inspection is recommended.” This language supports a focused decision.
🚫 Avoid Common Diagnostic Shortcuts
The most frequent mistake is demanding more engine power before understanding the cause. In heavy weather, this may increase fuel consumption and machinery stress with little practical gain. In a fouled-hull case, it can mask the developing performance penalty rather than solve it.
- Do not use GPS speed alone to declare a propulsion fault.
- Do not compare different drafts or weather conditions without correction.
- Do not override protective limits simply to meet a speed expectation.
- Do not assume a clean hull because no fouling is visible above water.
- Do not treat a single sensor reading as conclusive evidence.
🛠️ Match the Remedy to the Confirmed Cause
Environmental resistance may call for route, speed, trim, or weather-routing decisions. Steering-related loss may call for autopilot adjustment, sensor checking, or hull/propeller assessment. Fouling may justify cleaning at an appropriate opportunity, subject to port, environmental, and company requirements.
Machinery findings require the maker’s guidance and planned maintenance discipline. Fuel-system, turbocharger, shaftline, and CPP interventions can carry significant safety risks. The best repair is not the most dramatic one; it is the one supported by evidence and carried out within approved procedures.
📝 Turn Each Case into Better Future Data
After the cause is addressed, document the before-and-after condition: draft, trim, weather, rpm, power, speed, consumption, inspection findings, and work completed. This turns an operational problem into a more reliable baseline for the next voyage.
Performance monitoring is most valuable when it is continuous. A clean set of comparable records can reveal deterioration early, support dry-docking decisions, and make communication between vessel and shore team much more precise.
✅ The Core Principle: Follow the Energy Path
When a ship loses speed with apparently normal engine power, trace the energy path from fuel and air, through combustion and shaft power, into propeller thrust, and finally through the resistance of hull, sea, wind, current, and steering.
The answer may be a simple adverse current, or it may be a combination of slight fouling, unfavorable trim, wave resistance, and control losses. Good investigation does not chase a single culprit prematurely. It compares reliable data, recognizes uncertainty, and tests the most likely explanations in a safe order.
A ship’s speed is the final result of the whole propulsion system meeting the real sea environment—not a direct measure of engine health alone. Measure carefully, compare fairly, and let the pattern guide the next action. 🚢⚙️🌊