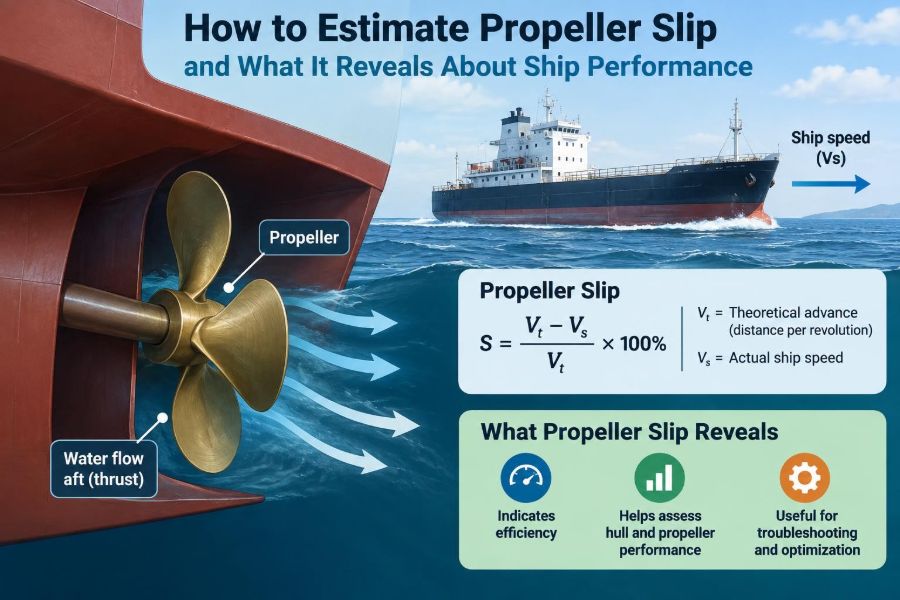

A vessel may be making the expected engine revolutions, yet arriving later than the passage plan suggests. The log shows a small loss of speed, fuel consumption has crept upward, and there is no single alarm that explains why.
In that situation, propeller slip is one of the first performance indicators worth checking. It links propeller pitch, shaft revolutions, and the ship’s measured advance through the water.
Slip does not identify every fault by itself. But when it is calculated consistently and read alongside draft, weather, trim, and machinery data, it can reveal a fouled hull, a damaged propeller, a loading change, or simply a misleading set of measurements.
For cadets, watchkeepers, and engineers, the value lies in turning familiar daily figures into a practical diagnostic tool.
⚓ What Propeller Slip Means
A propeller is designed with a geometric pitch: the theoretical distance it would move forward in one revolution if it travelled through a solid material without losses. Water is not solid, so the vessel advances less than that theoretical distance.
Propeller slip is the difference between theoretical propeller advance and the vessel’s actual advance, usually expressed as a percentage of theoretical advance. It is an operational performance measure, not a direct measurement of propeller efficiency.
🌀 The Thread-and-Screw Analogy
Imagine turning a screw into a wooden block. Each turn moves the screw forward by its thread pitch. A propeller resembles that screw, but it works in water, which can accelerate, swirl, and pass around the blades.
The analogy is helpful, although incomplete. A ship also creates resistance, the propeller operates in the vessel’s wake, and waves can alter the measured speed. Slip is therefore a useful summary of a complicated flow problem, not a complete hydrodynamic description.
📏 Pitch Is the Starting Point
For a fixed-pitch propeller, pitch is normally stated in metres. A 6 m pitch propeller has a theoretical advance of 6 m for every revolution.
Controllable-pitch propellers require extra care. Their effective pitch changes with blade setting, so the calculation must use the actual pitch or a reliable pitch-versus-command relationship. Using the design maximum pitch while the propeller is at partial pitch produces a meaningless result.
🔢 The Basic Formula
First calculate the theoretical distance travelled by the propeller:
Theoretical distance = pitch × propeller revolutions
Then compare it with the ship’s actual distance through water:
Slip (%) = ((theoretical distance − actual distance) / theoretical distance) × 100
Where speed and revolutions are used over the same time period, the equivalent speed form is:
Slip (%) = ((pitch × RPM × 60 − speed through water) / (pitch × RPM × 60)) × 100
Use consistent units. If pitch is in metres and RPM is revolutions per minute, convert the theoretical speed from metres per hour to knots before comparing it with knots.
🧭 Speed Through Water Versus Speed Over Ground
The formula needs speed through water (STW), often obtained from a speed log. GPS normally reports speed over ground (SOG), which includes the effect of current.
A following current can make SOG look excellent and make calculated slip appear unusually low. An adverse current has the opposite effect. GPS data are valuable for navigation, but they should not be substituted for STW unless current has been assessed and corrected with care.
🌊 Why Current Can Mislead the Calculation
Consider a ship whose true water speed is 12 knots. A 2-knot following current makes its GPS speed 14 knots; an adverse current makes it 10 knots. The propeller and hull condition may be unchanged, while a calculation based on SOG suggests a major change in slip.
For trend monitoring, use a calibrated speed log where available. If only position data are available, compare runs on reciprocal courses in similar conditions or use a measured current estimate, while treating the answer as less certain.
🧮 A Worked Fixed-Pitch Example
Suppose a fixed-pitch propeller has a pitch of 5.5 m and turns at 100 RPM. Its theoretical advance per hour is 5.5 × 100 × 60 = 33,000 m/h.
Since one nautical mile is 1,852 m, theoretical speed is about 17.82 knots. If the speed log shows 15.0 knots, the calculated slip is:
((17.82 − 15.0) / 17.82) × 100 = 15.8%
This hypothetical result is not automatically good or bad. Its real value comes from comparing it with the vessel’s own historical performance under similar draft, trim, weather, and engine condition.
🗓️ Choose a Meaningful Time Window
A one-minute calculation can jump around because of waves, steering corrections, log noise, and engine governor response. It may be useful for troubleshooting a stable trial, but it is a poor basis for judging general hull condition.
Use a steady period: for example, a sustained sea passage interval with relatively constant RPM, draft, and heading. Longer averages reduce random variation, provided the operating conditions have not changed within the interval.
📊 Record the Supporting Data
Slip should never be entered in a logbook as an isolated number. The context determines whether a change is significant.
- Date, time, voyage leg, and averaging interval
- Propeller RPM, pitch setting if applicable, and shaft power if available
- Speed through water and speed over ground
- Draft, displacement estimate, trim, and loading condition
- Wind, sea state, swell direction, and current estimate
- Hull-cleaning, propeller-polishing, and maintenance history
A structured record makes a gradual trend visible long before a single watchkeeper could reliably notice it.
🚢 Why a Ship Normally Has Slip
Slip is not proof that a propeller is failing. A propeller creates thrust by imparting momentum to water; if there were no change in the water flow, there would be no useful thrust.
Blade loading, hull resistance, wake flow, and energy lost in rotation all contribute to the difference between pitch speed and ship speed. The aim is not “zero slip.” The aim is a stable, explainable relationship between propeller operation and vessel advance.
🧠 Apparent Slip and True Hydrodynamic Behaviour
The simple shipboard formula is often called apparent slip. It compares geometric pitch with measured ship speed and is easy to calculate from operational data.
Hydrodynamic analysis may distinguish wake fraction, thrust deduction, inflow velocity, and propeller open-water characteristics. Those concepts are essential in design and specialist analysis, but they cannot be fully separated from a routine apparent-slip calculation. Avoid treating the daily figure as a laboratory measurement.
📈 Establish a Baseline, Not a Universal Target
Two ships with similar dimensions can have different normal slip because their propellers, hull forms, loading patterns, and service speeds differ. A universal “acceptable slip percentage” is therefore unreliable.
Build a baseline from the same vessel after confirming that its instruments are credible. Group records by operating condition, such as ballast, laden, slow steaming, and service speed. The useful question is: has this vessel changed from its normal pattern?
🧱 Hull Fouling Raises Resistance
Marine growth and slime increase skin friction. The main engine must then produce more thrust to maintain speed, or the vessel slows at the same power and RPM.
In comparable calm-water conditions, a progressive rise in apparent slip alongside poorer speed-power performance may support a hull-fouling diagnosis. It is supporting evidence, not proof; draft, weather, and log accuracy must be checked first.
🪸 Propeller Fouling and Surface Roughness
Roughness, coating damage, and marine growth on the blades disturb the smooth flow around the propeller. The result can be increased torque demand, reduced thrust for a given shaft condition, vibration, or cavitation risk.
Propeller fouling may change the operating pattern more sharply than general hull slime. A diver inspection or dry-dock observation is needed to confirm the physical cause rather than relying on slip alone.
🔧 Damage, Deformation, and Missing Area
A bent blade edge, damaged tip, or lost material can alter pitch distribution and blade loading. The ship may show abnormal vibration, changed shaft power, altered exhaust temperatures, or a poorer speed response.
These symptoms justify prompt engineering assessment. Calculated slip can help detect a change, but it cannot determine whether the problem is blade damage, a shaft-line issue, or an unrelated hull-resistance increase.
⚖️ Draft and Displacement Change the Picture
A laden ship has more wetted surface and generally greater resistance than the same hull in ballast. At a given RPM, its speed and calculated slip may therefore differ substantially.
Comparing ballast data directly with loaded data creates false alarms. Record draft and, where practicable, use separate trend lines for distinct displacement bands.
📐 Trim Can Alter Both Resistance and Inflow
Trim changes the underwater shape presented to the water and may alter how water approaches the propeller. A modest trim adjustment can affect resistance, wake quality, cavitation behaviour, and measured performance.
There is no single trim setting that suits every vessel and speed. The practical approach is to compare carefully documented conditions, respecting company procedures, stability requirements, visibility limits, and structural constraints.
🌬️ Wind, Waves, and Steering Losses
Head seas, swell, windage, and repeated rudder action all reduce average advance. In heavy weather, increased apparent slip may simply reflect the real additional resistance of the environment.
Do not diagnose fouling from rough-weather data. Tag such records clearly, then compare them with similar-weather passages or calm-water reference periods.
🧭 Shallow Water and Restricted Channels
In shallow or confined water, the hull and propeller operate in a different flow environment. Squat, bank effects, altered wake, speed restrictions, traffic avoidance, and frequent helm movements make a clean comparison difficult.
For routine hull-performance trending, open-water periods are usually more representative. Channel data can still be useful operationally, but should be treated as a separate category.
🛠️ Engine and Shaft-Line Clues
Slip belongs in a broader performance picture. At similar displacement and conditions, compare RPM, shaft power or torque, fuel rate, exhaust temperatures, turbocharger behaviour, and ship speed.
A speed loss with higher power demand points toward increased resistance or propulsion loss. A change in RPM-power behaviour may indicate an engine, governor, shaft, or propeller loading issue. The pattern matters more than a single value.
📉 Negative Slip Does Not Mean Free Energy
A negative calculated slip means the measured vessel speed exceeds geometric pitch speed. It does not mean the propeller is generating extra energy.
Common explanations include a following current used unintentionally in the calculation, an inaccurate speed log, incorrect pitch data, or a nominal pitch that differs from the propeller’s effective operating pitch. Investigate the inputs before drawing conclusions.
🧪 Validate the Instruments First
Speed logs can be affected by fouled sensors, air bubbles, shallow water, calibration drift, and installation effects. Tachometers, pitch indicators, and data-acquisition systems also require verification.
When a trend changes abruptly, first ask whether a sensor or calculation convention changed. Maintenance work, software updates, a new log source, or a revised pitch value can create an apparent performance shift without any physical change to the ship.
🧾 A Repeatable Calculation Workflow
- Select a steady open-water interval and identify the vessel’s operating condition.
- Confirm the pitch basis: fixed geometric pitch or documented controllable-pitch setting.
- Obtain average propeller RPM and speed through water for the same interval.
- Convert units consistently and calculate theoretical speed.
- Calculate apparent slip and record environmental and loading information.
- Compare only with relevant historical baseline data.
- Investigate persistent deviations using power, fuel, vibration, and inspection evidence.
Using one worksheet or a controlled spreadsheet formula prevents small unit mistakes from becoming repeated reporting errors.
💻 A Spreadsheet-Friendly Method
For a fixed-pitch propeller, a practical worksheet can calculate theoretical knots as:
Theoretical knots = (Pitch in m × RPM × 60) / 1852
Then calculate slip from theoretical knots and average STW. Keep raw inputs visible rather than pasting only the final percentage. A reviewer should be able to see which log, RPM, pitch, and time period produced the result.
🚫 Common Calculation Mistakes
- Using SOG without accounting for current
- Mixing shaft RPM with engine RPM when a reduction gearbox is fitted
- Using an incorrect fixed pitch or a nominal controllable-pitch value
- Comparing a short rough-weather sample with a calm-water baseline
- Ignoring changed draft, trim, or loading condition
- Rounding inputs too early, especially pitch and speed
- Interpreting one unusual result as confirmed mechanical damage
Most bad conclusions come from inconsistent data selection rather than difficult mathematics.
🔍 When a Change Deserves Investigation
A single outlier is often a data or weather issue. A sustained deviation across several comparable operating periods deserves attention, particularly when it agrees with increased fuel use, shaft-power changes, vibration, or a reported loss of speed.
Escalation should follow the vessel’s reporting system. It may lead to log calibration checks, a hull and propeller inspection plan, machinery diagnostics, or revised voyage-performance expectations.
🧼 Using Slip to Plan Cleaning
Trend data can help support decisions about underwater inspection, propeller polishing, or hull cleaning. It gives operators evidence that performance has shifted and helps assess whether cleaning restored the expected operating relationship.
Cleaning decisions also involve schedule, coating condition, environmental controls, cost, and the risk of damage. Slip is one input among many; it should not be treated as an automatic trigger.
📚 A Useful Training Exercise
Take three hypothetical voyage periods: a clean-hull baseline, a similar loaded passage several months later, and a post-cleaning passage. Calculate apparent slip for each using the same method.
Then list possible explanations for differences before choosing one. This exercise teaches the central discipline of performance analysis: calculate carefully, control the comparison, and seek corroborating evidence.
🤝 Bridge and Engine Departments Need the Same Data Story
The bridge team often holds navigation, weather, draft, and speed information. The engine department holds RPM, power, fuel, temperatures, and machinery observations. Neither view is complete alone.
A shared daily or voyage-performance record turns separate observations into a more reliable diagnosis. It also reduces the risk of blaming the engine for a current effect or blaming the hull for a faulty speed log.
✅ The Core Principle: Trend, Context, Confirm
Propeller slip is simple to estimate because it compares theoretical pitch advance with actual speed through water. Its interpretation is demanding because real ships operate in varying currents, weather, drafts, trims, and machinery states.
The most useful slip calculation is not the most dramatic number; it is the repeatable trend supported by comparable conditions and independent performance evidence. Used that way, it becomes a practical early-warning indicator of propulsion and hull-performance change.
Calculate carefully, compare like with like, and let the wider operating picture guide the next inspection or operational decision. That is how a small percentage becomes useful marine-engineering knowledge. ⚓📊🚢