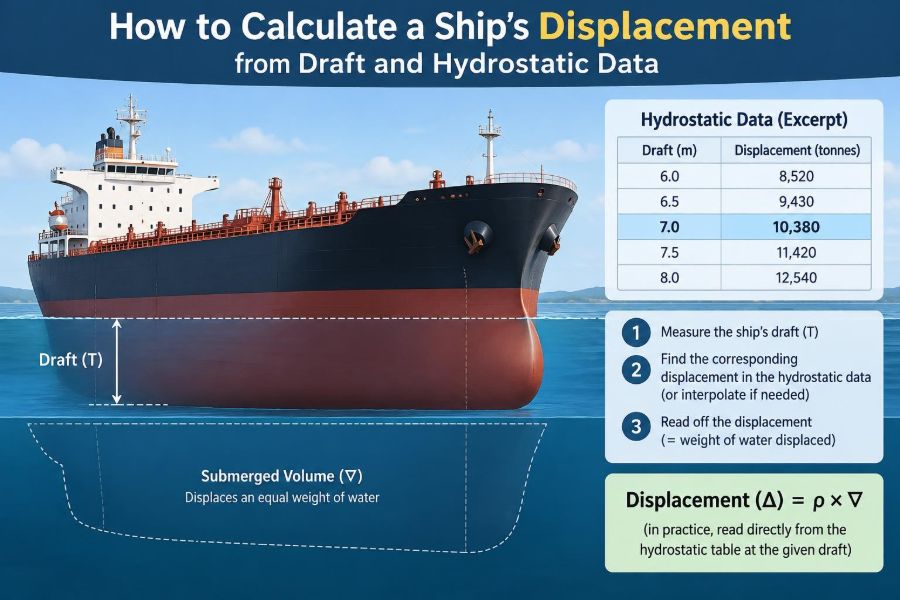

A vessel arrives alongside after loading cargo, and the chief officer needs a dependable estimate of the weight now carried. The draft marks have changed, but the answer is not found by simply multiplying draft by a fixed number. The hull does not displace water uniformly as it sinks.
The same calculation matters during cargo operations, bunkering, stability checks, dry-dock planning, and port-state documentation. A small error in observed draft, water density, or table interpolation can turn into a significant error in estimated mass.
Fortunately, the underlying idea is direct: a floating ship pushes aside a weight of water equal to its own weight. Hydrostatic data translate observed drafts into that displaced water volume or mass.
This guide develops the calculation from first principles, then shows how officers and engineers use a ship’s hydrostatic particulars carefully in real operating conditions.
⚓ What Ship Displacement Means
Displacement is the weight of water displaced by a floating ship. Under normal floating equilibrium, it is also the ship’s total weight: lightweight ship, cargo, fuel, fresh water, stores, crew, ballast, and all other onboard weights.
It is usually expressed in tonnes. Strictly speaking, displacement is a force, but marine practice commonly reports it as a mass in tonnes because the equivalence is practical and universally understood onboard.
Displacement is not the same as deadweight. Deadweight is the carrying capacity above lightweight; displacement is the complete weight of the vessel at a particular floating condition.
🛟 Archimedes’ Principle Behind the Calculation
Archimedes’ principle states that the buoyant force on an immersed body equals the weight of fluid it displaces. A ship settles deeper until this upward buoyant force balances its downward weight.
That means the calculation has two linked forms:
Displacement mass = Underwater volume × Water densityHydrostatic tables may give displacement directly for a stated water density, or they may give displacement volume. Knowing which one the booklet provides is the first essential check.
📏 Draft: The Measurement That Starts Everything
Draft is the vertical distance from the keel baseline to the water surface. Draft marks are normally read at the forward, midship, and aft positions on both port and starboard sides.
A hydrostatic table relates draft to the underwater geometry of that specific hull. As draft rises, underwater volume rises, but not necessarily at a constant rate because the hull shape changes with depth.
Read drafts as carefully as circumstances permit. A ripple, a passing wake, poor light, an inaccessible mark, or a vessel trimmed sharply by the stern can all affect the observed value.
🧭 The Difference Between Molded and Extreme Draft
Before opening the tables, identify the draft definition used by the ship’s approved hydrostatic data. Tables commonly use molded draft, measured to the molded baseline, while physical draft marks may be referenced to the underside of keel or another construction datum.
If the draft marks and tables use different reference points, apply the stated keel or baseline correction. Do not assume that a visible draft of 8.00 m can be entered directly into every hydrostatic table.
The vessel’s stability booklet, loading manual, and approved hydrostatic particulars should state the datum explicitly. This is a ship-specific issue, not a correction that can be borrowed from a similar vessel.
📚 What a Hydrostatic Table Contains
A hydrostatic table is a set of calculated hull characteristics at successive drafts, usually for even keel. It may be presented in metric or imperial units and is normally prepared for a stated water density.
Typical columns include:
- draft and displacement;
- underwater volume or volume of displacement;
- tonnes per centimetre immersion (TPC);
- waterplane area;
- longitudinal centre of flotation (LCF);
- longitudinal centre of buoyancy (LCB);
- metacentric quantities such as KM.
For a basic displacement estimate, draft and displacement are central. The other values become valuable when trim, small changes of draft, or stability calculations enter the problem.
🌊 Why Water Density Changes the Answer
A given underwater volume weighs more in dense seawater than in less dense dock water. Hydrostatic tables are often calculated for seawater of density 1.025 t/m³, but actual harbor water may be brackish or fresh.
If a vessel floats in water less dense than the tabulated reference, it must displace a larger volume to support the same onboard weight. Its observed draft will therefore be deeper than it would be in standard seawater.
Water density should be measured or obtained from reliable local information when accuracy matters. Temperature, salinity, river flow, tidal exchange, and local conditions can all affect it.
🧪 Displacement Volume Versus Displacement Mass
When a table gives volume of displacement, the conversion is straightforward:
Δ = ∇ × ρHere, Δ is displacement in tonnes, ∇ is displaced volume in cubic metres, and ρ is water density in tonnes per cubic metre.
For example, a hypothetical hull at its observed mean draft may displace 12,400 m³. In water of density 1.018 t/m³, its displacement is:
12,400 × 1.018 = 12,623.2 tonnesThis approach is often the clearest way to handle density, provided the hydrostatic booklet supplies volume.
🔎 Confirm the Table’s Reference Density
If the table gives displacement in tonnes rather than volume, read its notes carefully. A figure labelled “displacement” often assumes standard seawater, but that assumption must be confirmed from the publication.
Where displacement in standard seawater is given as ΔSW, an approximate density conversion to actual water is:
Δactual = ΔSW × (ρactual / 1.025)This works because the tabulated mass represents the same geometric displaced volume multiplied by 1.025 t/m³. It is a density correction to the hydrostatic value, not a substitute for correct draft observation.
👀 Take Draft Readings on Both Sides
A vessel may list because of uneven loading, wind, crane operations, tank levels, or free-surface effects. Reading only one side can give a misleading apparent draft.
At each station, calculate the local mean:
Local mean draft = (Port draft + Starboard draft) / 2Then use forward, midship, and aft local means to assess the overall condition. A pronounced list or unusual hull geometry may require the ship’s approved instructions rather than a simplified mean-draft method.
➗ Calculate Mean Draft Carefully
For a first estimate, the arithmetic mean of forward, midship, and aft drafts is often used:
Mean draft = (Df + Dm + Da) / 3For example, if the port-starboard averaged drafts are 7.84 m forward, 8.02 m amidships, and 8.20 m aft, the apparent mean draft is 8.02 m.
This is useful, but it is not always the correct hydrostatic mean draft for a trimmed ship. The forward and aft marks may also be displaced from the perpendiculars, which introduces correction requirements.
📐 Recognize Trim Before Using Even-Keel Data
Trim is the difference between aft and forward draft. A vessel is trimmed by the stern when the aft draft is greater, and by the bow when the forward draft is greater.
Most standard hydrostatic tables assume an even-keel condition. Applying them directly to a vessel with appreciable trim can introduce error because the average of visible drafts may not represent the equivalent even-keel displacement draft.
For quick operational estimates, a mean-draft reading can be adequate if trim is small and procedures allow it. For formal stability work, loading decisions, or close cargo accounting, use the vessel’s trim-correction method.
🧮 Correct for Draft-Mark Position
Draft marks are commonly located some distance forward of the forward perpendicular and aft of the aft perpendicular. When the vessel is trimmed, the reading at a mark differs from the draft at the corresponding perpendicular.
The correction depends on the mark’s longitudinal distance from the perpendicular, the vessel’s length between perpendiculars, and the trim. The sign depends on both mark location and whether the vessel is trimmed by bow or stern.
Approved loading-computer outputs and stability-booklet procedures are preferable because sign conventions differ. A familiar-looking formula applied with the wrong reference direction can worsen rather than reduce the error.
📍 Find the Draft at the Longitudinal Centre of Flotation
The longitudinal centre of flotation, or LCF, is the effective pivot point about which small changes in trim occur. For a trimmed condition, the draft at LCF is usually more useful than the simple average draft when entering even-keel hydrostatic data.
Conceptually, start with drafts corrected to the perpendiculars, determine the trim, and then adjust from a known longitudinal position to the LCF. The LCF location is listed in the hydrostatic table, often relative to midships.
Because LCF shifts with draft, use the value near the expected condition. This is why a loading computer is valuable: it handles an iterative geometry problem rapidly and consistently.
📈 Interpolate Between Table Entries
Hydrostatic tables are commonly tabulated at 0.10 m, 0.05 m, or another regular draft interval. Observed draft rarely lands exactly on a listed line, so interpolation is required.
For approximately linear variation over a small interval:
Value at target draft = Lower value + fraction × (Upper value − Lower value)The fraction is the target draft’s distance above the lower draft divided by the table interval. Over narrow intervals, linear interpolation is generally suitable for ordinary onboard work unless the approved data specify another method.
🧾 A Simple Interpolation Example
Suppose a hypothetical table in seawater gives 15,100 t at 8.00 m and 15,310 t at 8.10 m. The corrected hydrostatic draft is 8.06 m.
The draft lies 0.06 m into a 0.10 m interval, so the fraction is 0.60. The displacement change over the interval is 210 t:
Δ at 8.06 m = 15,100 + (0.60 × 210) = 15,226 tIf these figures are based on 1.025 t/m³ water and the actual density is 1.015 t/m³, the density-adjusted estimate is approximately 15,077 t. Keep more digits during calculation, then round only at the reporting stage.
⚖️ Understand Tonnes per Centimetre Immersion
TPC is the mass required to change a ship’s mean draft by one centimetre at a particular draft and water density. It is a local rate of change, not a universal constant for the vessel.
When changes are small, it offers a fast check:
Change in displacement ≈ TPC × change in mean draft (cm)For instance, a vessel with TPC of 24 t/cm that sinks 3 cm after bunkering has increased displacement by roughly 72 t. This is an approximation; TPC itself changes as draft and waterplane area change.
🗺️ Waterplane Area Explains TPC
The waterplane area is the horizontal area enclosed by the waterline. A broad, nearly rectangular waterplane gains buoyancy quickly as it sinks, producing a higher TPC than a narrow waterplane.
In metric terms, TPC is related to waterplane area and density:
TPC ≈ Waterplane area × water density / 100This relationship provides a useful plausibility check. If a reported TPC is inconsistent with the table’s waterplane area, check units, decimal positions, and density assumptions before relying on it.
🧱 From Displacement to Deadweight
Once current displacement is known, deadweight can be estimated by subtracting lightweight:
Deadweight = Current displacement − LightweightLightweight includes the ship’s structure, machinery, permanent equipment, and other items defined in the approved lightweight survey or stability documentation. It is not simply “the empty ship” in an informal sense.
To estimate cargo from displacement, subtract all non-cargo variable weights as well: bunkers, lubricants, ballast, fresh water, provisions, crew effects where relevant, and known onboard consumables. Each component has its own uncertainty.
🧳 A Practical Cargo-Operation Use Case
Imagine a bulk carrier is loaded to a planned departure draft. The officer observes drafts before and after loading, applies approved draft and trim corrections, and obtains displacement from the hydrostatic data.
The difference between final and initial displacement represents the total weight added or removed between observations. It is not automatically cargo weight: ballast transfers, bunker deliveries, water consumption, and material landed ashore must be accounted for.
This is the basis of a draft survey. A well-executed survey is a disciplined mass balance, not merely a single draft-table lookup.
📝 The Core Draft-Survey Sequence
A typical calculation workflow is as follows:
- Read forward, midship, and aft drafts on port and starboard.
- Average port and starboard readings and inspect list and trim.
- Apply draft-mark, hog/sag, and trim corrections required by approved procedures.
- Determine corrected hydrostatic draft, often at or equivalent to LCF.
- Interpolate displacement or displaced volume from the hydrostatic tables.
- Apply actual-water-density treatment consistently.
- Compare initial and final corrected displacements and adjust for non-cargo weight changes.
Record every observation, correction, density value, table source, and assumption. A calculation that cannot be checked is difficult to defend or improve.
📏 Distinguish Density Correction from Dock Water Allowance
Dock water allowance (DWA) is often used to predict how much deeper a vessel at a specified load line will float when moving from seawater into less dense water. It is a load-line and operational planning concept.
Density correction in a displacement calculation addresses the mass associated with a measured underwater volume or with hydrostatic values prepared at a reference density. The two ideas are related by buoyancy, but they should not be applied as duplicate corrections.
A common error is to adjust observed displacement for density and then separately apply DWA to the same purpose. Follow the method specified in the ship’s documentation or survey procedure.
🏗️ Hogging and Sagging Can Distort Mean Draft
A long hull can bend slightly with wave loading and weight distribution. Hogging means the midship region is higher relative to the ends; sagging means it is lower.
With hogging, the midship draft may be less than a linearly expected value; with sagging, it may be greater. Since hydrostatic tables assume a designed hull form rather than a bent hull, a three-draft average can be biased.
Some draft-survey procedures include a hull-deflection correction derived from the difference between observed midship draft and the mean of corrected forward and aft drafts. Use only an approved method and understand its sign convention.
🚧 Sources of Uncertainty in Draft Readings
No displacement derived from draft is exact to the last tonne. Conditions at the hull create practical limits:
- waves, swell, wake, and changing tide level;
- fouled, painted-over, or partially submerged draft marks;
- parallax when reading from an angle;
- list, trim, and inaccessible far-side marks;
- uncertain water density or a sample unrepresentative of the ship’s location;
- tank soundings and unrecorded transfers during a survey.
The right response is not false precision. State the method, retain sensible decimal precision during calculation, and report a result appropriate to the quality of the observations.
❌ Common Calculation Mistakes
The most frequent mistakes are procedural rather than mathematical. They occur when a correct formula is used with an unsuitable input.
- Entering physical draft marks into tables without checking the datum.
- Using one side’s draft despite a noticeable list.
- Ignoring trim and mark-position corrections on a long vessel.
- Mixing metres and centimetres when using TPC.
- Using seawater displacement as though it applied unchanged in fresh or brackish water.
- Applying a density correction twice.
- Confusing displacement with cargo weight or deadweight.
A structured worksheet and an independent reasonableness check prevent many of these errors.
🔁 Use Iteration When the Correction Depends on the Result
Trim corrections may depend on LCF, displacement, or moment-to-change-trim values that themselves vary with draft. In that situation, make an initial estimate, obtain the relevant hydrostatic values, apply the correction, and repeat if the result changes materially.
Usually only a small number of iterations is needed because the values vary gradually over a narrow draft range. A loading computer performs this automatically, but the operator should still recognize when an output conflicts with observed drafts or operational reality.
💻 Loading Computers Help, but Do Not Replace Observation
An approved loading computer can calculate displacement, stability, trim, longitudinal strength, and tank effects far faster than manual tables. It reduces arithmetic workload and provides scenario comparisons before cargo or ballast operations.
Its quality depends on its inputs. Incorrect drafts, stale tank data, wrong density, or an unupdated lightweight condition can produce a polished-looking but unreliable answer.
Manual hydrostatic understanding remains valuable because it allows officers and engineers to challenge unexpected results, cross-check routine operations, and continue safe work when digital systems are unavailable.
🧠 Perform a Quick Reasonableness Check
Before accepting a result, ask whether it matches the physical change observed. If 100 tonnes were loaded and the local TPC is around 20 t/cm, a mean sinkage near 5 cm is plausible. A reported change of 50 cm deserves investigation.
Also compare the calculated displacement with the vessel’s known lightship and deadweight limits. A result below lightweight, above approved displacement limits, or inconsistent with tank inventories is an immediate warning sign.
These checks do not replace the formal method. They catch transposed digits, missed signs, incorrect density entries, and unit errors while there is still time to correct them.
📖 Worked Example from Observation to Displacement
Consider a hypothetical vessel with port-starboard averaged observed drafts of 8.00 m forward, 8.12 m amidships, and 8.24 m aft. Its apparent mean draft is 8.12 m and it has 0.24 m trim by stern.
Assume the approved procedure, after correcting draft-mark positions and transferring to LCF, gives an equivalent hydrostatic draft of 8.10 m. The seawater hydrostatic table shows 15,100 t at 8.00 m and 15,310 t at 8.10 m.
Because the corrected draft is exactly 8.10 m, tabulated seawater displacement is 15,310 t. A measured dock-water density of 1.015 t/m³ gives:
15,310 × (1.015 / 1.025) = approximately 15,161 tThe estimated displacement is therefore about 15,161 t, subject to the accuracy of the readings and approved corrections. It would be wrong to call this cargo weight without separately accounting for lightweight and all variable onboard weights.
📋 Keep a Transparent Calculation Record
A professional record should let another competent person reproduce the result. At minimum, include date and time, location, weather or water conditions, all six draft readings, draft datum, density source, hydrostatic-table reference, corrections, and final displacement.
For cargo claims or commercial surveys, record tank soundings, temperature where relevant, ballast movements, bunker movements, and any materials loaded or discharged between observations. Transparency matters because the final number is built from several measured and estimated quantities.
🧭 When to Escalate Beyond a Simple Calculation
A basic hand calculation is not enough when draft marks are unreadable, sea state prevents stable observation, trim or list is substantial, hull deflection is evident, or the result will support a high-consequence stability or commercial decision.
Use the approved stability documentation, loading computer, company procedure, or qualified survey support appropriate to the task. If different methods produce materially different answers, investigate the inputs rather than selecting the more convenient figure.
✅ The Core Principle to Remember
The calculation rests on one physical fact: a floating ship weighs the same as the water it displaces. Draft tells us how much of a particular hull is underwater; hydrostatic data convert that geometry into volume or displacement; water density converts volume into weight where necessary.
The reliable sequence is equally simple: observe drafts well, correct them for the ship’s geometry and condition, interpolate the correct hydrostatic value, apply density consistently, and document uncertainty. Accuracy comes from disciplined inputs more than complicated arithmetic.
A hydrostatic table is only as trustworthy as the draft reference, trim treatment, and water-density information used to enter it.
Read the hull carefully, use the ship-specific hydrostatic data correctly, and displacement becomes a practical measure of the vessel’s total floating weight rather than a guess from the draft marks. ⚓🌊📐