
A vessel can leave dry dock with a smooth, freshly coated hull and a clean propulsion system. A few months later, the crew may notice that the ship needs more engine power to hold the same service speed. Nothing obvious has changed in the engine room, yet the daily fuel figures have begun to drift upward.
Often, the missing variable is below the waterline. Slime, algae, barnacles, tube worms, and other marine organisms can turn a smooth hull into a rougher surface that creates substantially more resistance through the water.
Hull fouling is not merely a paint-maintenance issue. It affects voyage planning, bunker costs, emissions, machinery loading, charter-party performance discussions, and the timing of underwater cleaning or dry docking.
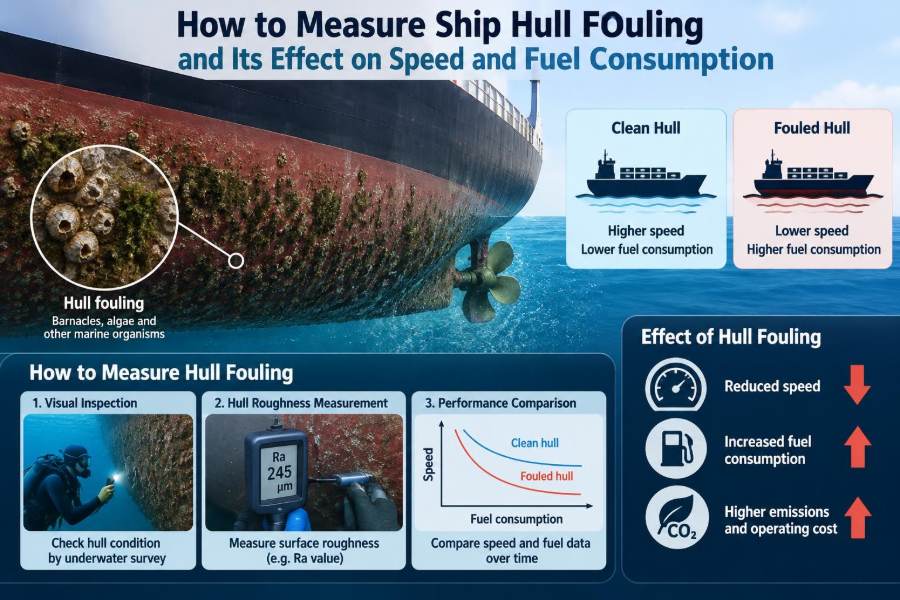
Measuring its effect properly takes more than looking at a fouled patch of plating. It requires a disciplined comparison of hull condition, weather, draft, speed, power, fuel consumption, and operational data. The goal is to separate a genuine hull-performance loss from the many other reasons a ship may consume more fuel.
🌊 What hull fouling means
Hull fouling is the unwanted accumulation of organisms and biological material on submerged surfaces. It may develop on the flat bottom, vertical sides, bilge keels, sea chests, rudder, propeller, and other appendages.
Early-stage fouling is often a soft film, sometimes called slime or biofilm. More mature fouling can include larger calcareous organisms such as barnacles and tube worms. The type, thickness, coverage, and location all influence its hydrodynamic effect.
🧲 Why a rough hull needs more power
Water flowing along a ship’s hull develops a thin boundary layer. Near the surface, flow is slowed by friction. A clean, smooth coating keeps this frictional resistance as low as practical; roughness disturbs the flow and increases skin friction.
The result is a larger total resistance at a given speed. To overcome that resistance, the propeller must deliver more thrust, which usually means higher shaft power and more fuel. Alternatively, if power remains fixed, the vessel loses speed.
⚓ The main resistance components
Total ship resistance is commonly understood as a combination of frictional resistance, wave-making resistance, air resistance, appendage resistance, and other smaller components. Fouling chiefly increases frictional resistance, but severe growth on appendages can also create separation and added drag.
At lower and moderate speeds, friction is often a dominant part of total resistance for displacement ships. This is why even apparently modest surface roughness can have a commercially meaningful effect.
🦠 From slime to hard-shell growth
Not all fouling is equally harmful. A light slime layer may be difficult to see from deck but can still alter surface texture across a very large wetted area. Patchy barnacles may create a stronger local roughness effect, especially where they cover large regions or lie near disturbed-flow areas.
| Condition | Typical appearance | Likely operational concern |
|---|---|---|
| Microfouling | Thin biofilm or slime | Gradual friction increase; easily overlooked |
| Soft macrofouling | Weed, hydroids, soft organisms | Variable drag, often seasonal and location-dependent |
| Hard macrofouling | Barnacles, tube worms, shells | High local roughness and difficult removal |
A practical assessment should record the fouling category rather than simply calling a hull “clean” or “dirty.”
📏 Speed, power, and fuel: the key relationship
A ship’s speed is not proportional to power in a simple one-to-one way. In general, the power required to increase speed rises steeply, often roughly with the cube of speed over a limited operating range. The exact relationship depends on hull form, loading condition, sea state, and propulsion arrangement.
For performance monitoring, the most useful question is usually: how much additional power or fuel is needed to achieve the same corrected speed and draft? This is more meaningful than comparing raw daily fuel figures from unrelated voyages.
🧭 Choose a reliable performance baseline
Every fouling assessment needs a reference condition. The strongest baseline is gathered shortly after dry docking, hull cleaning, or a verified clean-hull inspection, using several voyages in comparable conditions.
Build a speed-power or speed-fuel curve for common drafts. A baseline derived from multiple good-quality observations is more reliable than one “perfect” trial day, because normal ship operation contains unavoidable scatter.
📝 Start with consistent noon-report data
Noon reports remain a valuable source of trend information when crews enter data consistently. Useful fields include distance run, average speed, fuel consumed by consumer, shaft revolutions, engine load, draft, trim, weather, sea state, wind direction, and currents where available.
These records are imperfect, but a long, carefully screened series can reveal deterioration. The greatest value comes from repeatable definitions: for example, deciding whether “speed” means log speed, GPS speed over ground, or a corrected estimate through water.
🛰️ Distinguish speed through water from speed over ground
A following current can make a vessel appear efficient if only GPS speed over ground is used. An opposing current can make a clean ship look badly fouled. Hull resistance, however, depends on the vessel’s motion through the water.
Speed logs, Doppler logs, current models, and route-data systems can help estimate speed through water. Each has limitations, particularly in shallow water, restricted channels, or strong variable currents, so the chosen method should be documented.
🌬️ Correct for wind, waves, and swell
Weather adds resistance. Head seas, short steep waves, windage, and swell can all raise fuel consumption or reduce speed. A comparison between a calm-water voyage and a winter passage in rough seas says little about fouling unless weather effects are addressed.
A simple operational approach is to filter out poor-weather observations. More advanced systems apply weather correction models. These models improve comparison, but they are estimates, not perfect reconstructions of every wave encounter.
⚖️ Compare like with like drafts and trim
Draft changes wetted surface area, displacement, and propeller immersion. Trim changes the flow into the propeller and can alter resistance. A loaded bulk carrier and a light ballast passage should not be compared as if they were identical conditions.
Group data by draft range and, where practical, by trim range. For vessels that frequently trade in a few standard loading conditions, separate baseline curves are often more useful than one broad average.
🔧 Account for engine and propeller condition
Rising fuel consumption is not automatically a hull problem. Injector condition, turbocharger fouling, scavenge-air performance, fuel quality, shaft-line losses, and control settings can change the power needed or fuel burned per unit of power.
Propeller roughness and fouling are particularly important because the propeller sits at the point where engine power becomes thrust. A clean hull with a fouled propeller may still perform poorly, while hull and propeller fouling often develop together.
🪸 Inspect the underwater surface directly
Data identifies a performance trend; inspection helps explain it. Diver surveys and remotely operated vehicle inspections can document fouling distribution, coating damage, corrosion, damaged anodes, and propeller condition.
Ask for clear images or video with location references. “Moderate fouling” is less useful than a report showing whether growth is concentrated at the boot-top, flat bottom, sea-chest grilles, rudder, or propeller.
📸 Use a repeatable fouling classification
To make inspections comparable, use the same classification method each time. Record organism type, approximate coverage, density, size, and affected zones. Photographs taken at consistent distances and lighting conditions help later reviewers judge change.
Classification is still partly subjective. Two surveyors may describe borderline slime differently, which is why image evidence and repeated methods matter more than a single descriptive word.
🗺️ Map where growth occurs
Fouling distribution matters. A vessel that is regularly underway may have limited growth on high-flow surfaces but heavier fouling around sheltered recesses. Long idle periods encourage settlement across wider areas.
Mapping also identifies targeted maintenance opportunities. A blocked sea-chest grille has operational implications beyond drag, while fouling on a rudder or bilge keel may have an outsized effect relative to its area.
🌀 Do not overlook the propeller
Propeller blades can acquire slime, calcareous deposits, or coating loss. Even small roughness on blade surfaces may reduce propulsive efficiency because the blades operate under high local loading and must create lift efficiently through water.
Inspect blade faces, leading edges, hubs, and the area around the boss. Record dents, cavitation erosion, and mechanical damage separately from fouling; each can influence vibration, efficiency, and delivered thrust.
📊 Plot speed against power, not only fuel
A practical chart places corrected speed through water on one axis and shaft power on the other. Points from a clean period form a reference band. Later points that require more power for the same speed may indicate added resistance.
A second chart can compare fuel rate with power. If fuel per unit power has worsened while the speed-power relationship remains stable, the problem may lie more in machinery efficiency than hull resistance.
🧮 A simple normalized performance indicator
One useful internal indicator is the power required at a chosen reference speed, adjusted as consistently as possible for draft and weather. Another is the speed achieved at a defined shaft-power setting under screened conditions.
For example, a fleet team may compare the corrected power needed to make a reference speed in a particular ballast draft range. The number itself is less important than its trend from the clean baseline. Avoid treating a simplified indicator as a precise physical measurement.
📉 Look for a trend, not one bad voyage
Marine performance data is noisy. A single passage may be affected by current error, weather, congestion, steering activity, draft uncertainty, or inaccurate fuel sounding. Fouling normally appears as a sustained worsening trend across many comparable observations.
Use rolling averages or grouped voyage data. Investigate a persistent deviation, particularly after extended anchorage or a period in warm, biologically active waters, rather than reacting immediately to one unusual noon report.
⏱️ Watch idle time and trading pattern
Fouling risk is strongly connected to how a ship trades. Extended waiting at anchor, repeated port stays, low-speed operation, and warm coastal waters generally provide more opportunity for organisms to settle and grow.
That does not mean every idle vessel will foul at the same rate. Salinity, season, light, local species, coating condition, and hull movement all influence the result. Operational history provides context, not certainty.
🎨 Understand the role of antifouling coatings
Antifouling coatings are designed to reduce attachment or make attached organisms easier to remove. Their performance depends on the product system, application quality, film thickness, trading pattern, mechanical damage, and time in service.
A coating should not be judged solely by its age. Some coatings depend on water flow or specific operating conditions to renew their surface effectively, while others have different mechanisms. Consult the coating supplier’s technical guidance for the actual system fitted.
🧽 Decide when underwater cleaning is justified
Underwater hull or propeller cleaning may recover performance before the next dry dock. The decision should balance expected fuel and schedule benefits against cleaning cost, coating risk, local restrictions, water-quality requirements, and availability of competent contractors.
Cleaning is most defensible when inspection evidence and normalized performance data point in the same direction. Cleaning purely because fuel use rose during bad weather can waste money and obscure the real cause.
🛑 Manage cleaning risks carefully
Abrasive or poorly controlled cleaning can damage coatings, expose the substrate, or shorten future coating life. Removed organisms and coating particles may also create environmental concerns, which is why port and flag-related requirements must be checked before work begins.
Specify the cleaning method, capture arrangements where required, acceptance standard, photographic evidence, and post-cleaning performance review. The cheapest method is not necessarily the lowest-cost option over the coating’s full service life.
🧠 Common measurement mistakes
- Comparing speed over ground without correcting for current.
- Comparing loaded and ballast voyages without draft grouping.
- Calling every fuel increase “hull fouling” before checking machinery condition.
- Using a single observation instead of a sustained trend.
- Ignoring propeller fouling and appendage condition.
- Using inspection descriptions without photos, locations, or a consistent scale.
These errors are common because ship performance is influenced by many changing variables. A simple, repeatable method is usually more valuable than a highly complex analysis built on inconsistent inputs.
🔍 A practical investigation workflow
- Confirm the reported speed, fuel, draft, and weather data are credible.
- Screen out clearly non-comparable voyages or severe weather periods.
- Compare corrected speed-power data with the clean-hull baseline.
- Check fuel-per-power trends to identify possible machinery contributions.
- Review idle time, recent ports, coating age, and operating history.
- Arrange an underwater inspection if the performance trend persists.
- Choose cleaning, machinery action, or continued monitoring based on combined evidence.
This workflow does not eliminate uncertainty, but it creates an auditable chain from observation to decision.
💼 Translate performance loss into operational impact
A fouled hull can be expressed in different ways: added power at a target speed, speed loss at a power limit, extra fuel per day, or added fuel over a voyage. Each is useful to a different decision-maker.
For voyage planning, speed loss may be most visible. For technical management, added shaft power can help identify resistance growth. For commercial evaluation, fuel impact must be considered alongside fuel price, time charter terms, schedule requirements, and the cost of intervention.
🧪 A hypothetical comparison
Consider a vessel operating at the same approximate draft on two calm-water passages. After a recent cleaning, it makes its reference speed at one power level. Several months later, screened data shows that it repeatedly needs noticeably more power to maintain that speed, while fuel consumed per unit power remains broadly similar.
That pattern is consistent with added hydrodynamic resistance, though it does not prove hull fouling by itself. If an underwater inspection then finds widespread slime and propeller deposits, the evidence becomes much stronger. This is a hypothetical example, not a universal diagnostic rule.
🤝 Connect deck, engine, and shore teams
Good hull-performance management crosses departmental boundaries. Deck teams provide operational context and accurate logs; engine teams track power, fuel, revolutions, and machinery condition; shore staff analyze trends and arrange surveys or maintenance.
Shared definitions prevent avoidable disputes. Everyone should know which speed is being reported, which fuel consumers are included, how weather is recorded, and what counts as a valid comparison point.
📚 Build a useful vessel performance record
Keep dry-dock reports, coating specifications, application records, underwater survey images, propeller-polishing reports, cleaning certificates, and normalized performance charts in one accessible record. Over several docking cycles, this history reveals patterns that a single campaign cannot.
It can also support better planning: selecting coating systems suited to actual trading, anticipating cleaning needs after idle periods, and comparing post-maintenance recovery with expectations.
⚖️ Know the limits of the calculation
Even sophisticated analysis cannot observe every force acting on a ship. Wave direction and encounter frequency vary continuously, currents are uneven, hull condition is not perfectly uniform, and onboard measurements have error.
For that reason, state conclusions proportionately. It is usually sound to say that data indicates increasing resistance consistent with fouling. It is less sound to claim an exact percentage of loss without a validated method and sufficiently controlled data.
🚀 The core principle for better decisions
The best fouling assessment combines three forms of evidence: a clean and well-defined baseline, corrected operational performance data, and direct underwater inspection. No single source is enough in every case.
Measure comparable conditions, look for sustained deviation, rule out machinery and environmental causes, then verify what is actually on the hull and propeller. This approach turns an uncertain fuel increase into a maintenance decision supported by evidence.
A ship’s hull condition should be managed as a measurable part of propulsion performance, not guessed from fuel figures alone. Careful trending, inspection, and timely action protect efficiency while avoiding unnecessary intervention. 🚢🌊🔧