This is a measure of the directional stability of the vessel. Imagine a situation where your vessel drifts off the course without any indication and when it is detected, the change in direction is already very large. This condition is not appropriate for navigational wellness.
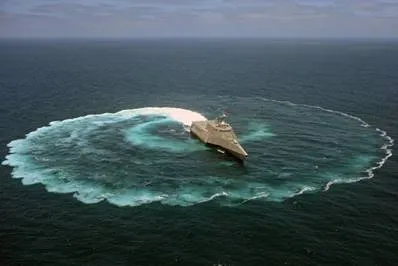
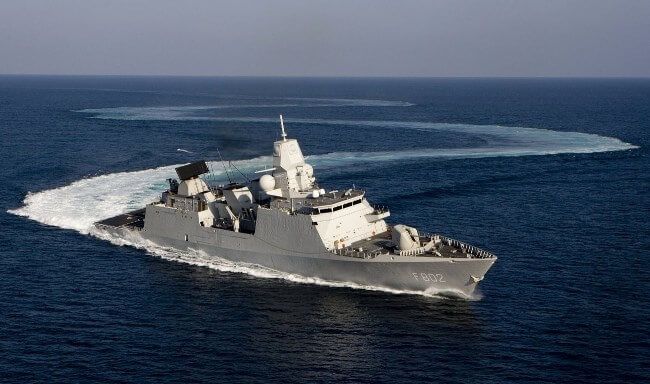
Figure 3: Frigate undergoing Spiral Manoeuvre
Consider another situation where the vessel is required to swerve past some obstruction. The rudder angle is applied in the necessary direction to avoid a collision but for some time the vessel continues to go in that direction before changing the rate of heading. But it is already too late and the unwanted occurs. No one would prefer to face that situation, would they? So, the efficiency of the ship in terms of its directional stability is measured by its ability to change its direction in immediate response to its rudder action.
The spiral manoeuvre also known as Dieudonne spiral is conducted for this purpose. This test is somewhat similarly done as zigzag but the rudder deflection angles are constantly varied from port to starboard (+15, +10, +5,0,-5,-10,-15, for example).
Figure 4. Trajectory of the ship in a spiral manoeuvre
The spiral manoeuvre trial is conducted as follows:
· The ship is steadied on a straight line course
· After that, the rudder is put hard over to one side until the rate of change of heading is constant (Constant Yaw rate)
· The ship is steadied for this new rate of heading. Then it is again given a rudder deflection to a higher value, say 10 degrees.
· The process is repeated for successive values of rudder angle till the rudder has covered the whole range to maximum rudder angle on the given side
· The entire process is conducted in the reverse direction, that is if the rudder turns are given for successive values on the starboard side (+5, +10, +15….) , it now given to the opposite direction to the port side ( -5, -10, -15….) to give a counter clock path
· The path observed, in either case, is a spiral as shown in the figure
· The rate of turn or yaw is noted for each rudder angle
· The yaw rate is plotted against rudder deflection angle for analysis
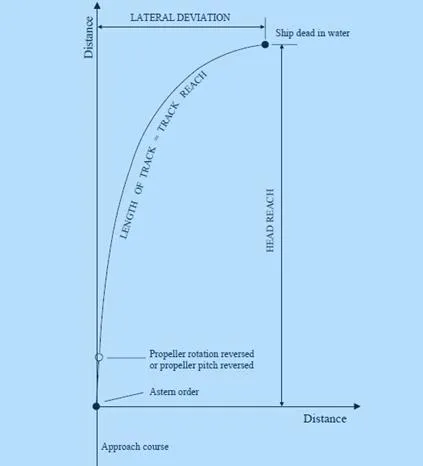
Figure 5: Rudder angle versus the rate of change of heading
The above figure shows the rudder angle versus the rate of change of heading. In figure 5(a), the values are plotted for a perfectly directional-stable ship. Applying a rudder deflection to starboard yields a heading in that direction. So the yaw rate (rate of change of angular heading), “r” varies proportionally to the rudder deflection in the same direction. When the rudder angle is brought back to its mean position (zero deflection), the angle of heading also gets back to zero along with the yaw rate. Hence, the ship does not have any ‘residual heading’ in that direction and is considered perfectly stable. Similarly, again turning the rudder to port gives a proportionate increase of yaw rate to port. The curve passes through the origin.
But rarely do we find such ideal results. Environmental factors such as sea states, currents, waves along with the interplay of rudder response, engine performance and other hydrodynamic factors lead to instability as shown in figure 5(b). Here, even when the rudder angle is brought back to zero in either case of port or starboard the rate of heading angle remains non-zero. That is, in response to rudder angle change there is a ‘directional set’. This is indicated by the dotted lines. When the rudder is brought back to zero after the starboard turn, the rate of change of heading remains to some starboard value and then gradually starts reverting to port. Similarly, it is true in the opposite case. Thus the curve plotted (yaw rate vs rudder angle) in both clockwise and counterclockwise turn gives a kind of hysteresis loop. None of the yaw rates from any sense is zero for an immediate response to the rudder. This hysteresis loop is a measure of the ‘directional instability’ of the vessel.
This test should be essentially performed for yaw unstable ships going from port to starboard and from starboard to port. However, some of the big limitations of performing this tests are congenial sea states and a large expanse of water. Also, it is very time-consuming.
Reverse Spiral
As an alternative to spiral manoeuvres, reverse spiral tests were introduced by Bech. This is very much similar to direct spiral manoeuvre with one basic change. The ship is now strictly made to turn at a constant rate of turn (yaw rate). This is achieved by manipulating the rudder accordingly. Thus this is exactly the opposite of what was done in direct spiral manoeuvre (where the yaw rate was variant for a particular rudder deflection)!
This is conducted for a range of yaw rates from +0.5 degrees per second rate to starboard to -0.5 degrees per second to port. This is plotted against the rudder deflection as shown in the following figure.
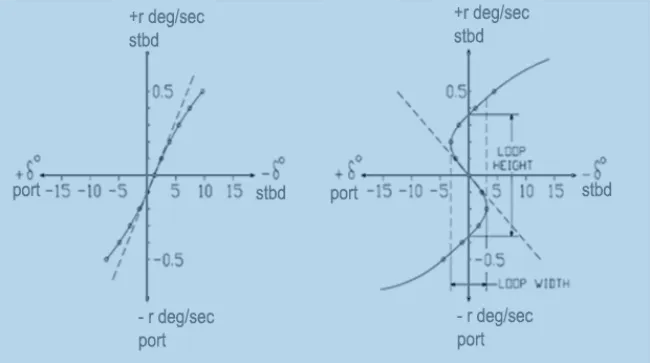
Figure 6: Reverse Spiral
The slope of the curve at the origin gives a measure of the degree of directional stability. In figure 6(a), the slope at the origin (r-δ at δ=0) is negative, hence the ship is said to be directionally stable.
On the contrary in figure 6(b), a kind of hysteresis is formed in the form of an S-shape similar to direct spiral (except it is an open loop in this case). The slope of the tangent at the origin is positive and the ship is said to be directionally unstable.
The aspect of rudder deflection versus yaw rate, in this case, is somewhat analogous to the righting lever (GZ) versus heel angle (φ) in the case of static transverse stability problem.
Pull-Out Test
This test is a relatively simpler to determine the stability of the ship on a straight course.
The steps taken to conduct this trial are:
· The ship is made to turn in both port and starboard directions for sometime.
· After a steady rate of yaw in the particular direction is achieved, the rudder is brought back to its mean position.
· The rate of turn exhibited over the entire span of time is recorded for both port and starboard turn.
· The nature of the rate of turn is characterised by plotting against time.
Theoretically, for ideal conditions the rate of heading must revert back to zero after the rudder is brought back to zero. But practically, this is rarely the case as there is always some nonzero value of heading in either direction (port or starboard). However, as long as this is similar in both directions, it is still considered stable. But if it is different in both port and starboard, it is unstable. In most of the ships, there is always this ‘residual rate’ of heading due to the asymmetry of flow across the hull and sometimes due to propeller influence (in the case of single screw ships).
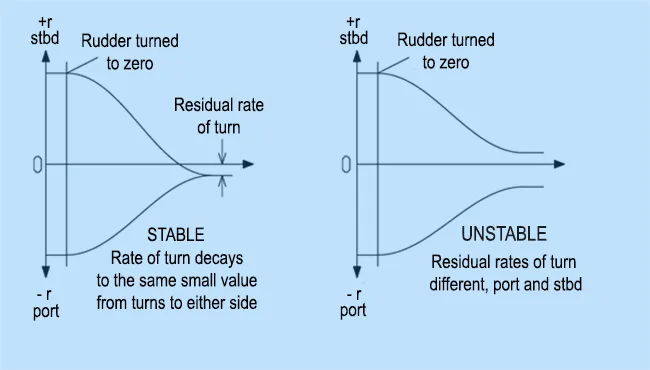
Figure 7. Analysis of Pull-out Manoeuvre
Stopping Ability
Accelerations, stopping and backing are not part of manoeuvring exercises but they are still carried out in tandem with the above manoeuvres to check the safe stopping distance and motion efficiency of the vessel. Imagine a critical situation where there is an obstruction ahead at a limited distance and the ship is required to stop or reduce its speed.
Thus stopping trials such as “Crash Stop” are crucial for estimating the performance of the vessel under this kind of circumstances.
Stopping ability is measured by the “track reach” and “head reach” realised in a stop engine-full astern manoeuvre performed after a steady approach at the test speed until ahead speed in ship coordinates changes sign (i.e., vessel starts going backwards).
· Track Reach is defined as the distance traversed by the ship in its own path after the “astern command” is given (engine reversed) until the vessel starts heading backwards.
· Head Reach is the perpendicular distance (displacement) that is measured from the point of execute (reverse order given) to the point where the ship starts coming backwards (after stopping).
Figure 8. Representation of Head Reach and Track Reach
Both Head Reach and Track Reach along with the time taken to achieve so are of paramount concerns to the ship designer, the engine maker, as well as to the seafarer. Most safe designs tend to achieve the least distance and time required to decelerate and stop. However, propeller performance, sea conditions, displacement of the vessel and efficient control hierarchy on board are some of the other indispensable factors.
Motion and Control of a vessel along with their trials play a pivotal role in the design and also in the post-launch stage as we had already said earlier. IMO has its own criterion while performing each of the above trials which we leave it you to find out of interest. Modern techniques of model tests, Computational Fluid Dynamics (CFD) or Boundary Element Methods (BEM) aided by software have eased manoeuvring and seakeeping analysis to a great extent. Nevertheless, these full-scale trials still are considered the most holistic approaches and are continued to be carried out for each and every vessel.

Comments are closed