MAIN ISSUES OF COASTAL ENVIRONMENTS
Until now, there has been no strict definition of coastal zones. Generally, coastal zones are the transition zones between the land and the ocean [1]. As defined by the International Geosphere Biosphere Programme (IGBP) via its Land Ocean Interactions in the Coastal Zone (LOICZ) program, the coastal zone is the entire region from the 200 m bathymetric contour in the sea to the 200 m elevation contour on land [2]. The coastal zone represents a comparatively small but highly productive and extremely diverse system with a variety of ecosystems [3]. Hence, the coastal zone is clearly of major economic and social importance. For example,
(a) the coastal zone occupies 18% of the surface of the globe,
(b) it is the area where approximately one quarter of global primary productivity occurs,
(c) it is where approximately 60% of the human population lives,
(d) it is where two thirds of the world’s cities with populations of more than 1.6 million people are located, and
(e) it supplies approximately 90% of the world’s fish catch [4]. Therefore, monitoring the coastal zone is meaningful.
Currently, coastal zone monitoring primarily includes the content of the shoreline displacement, landscape change, ecosystem change, and environmental pollution. The total suspended matter (TSM) concentration was estimated from MODIS data using a neural network model in China’s eastern coastal zone [5]. The trend of sea surface temperature (SST) was monitored from MODIS data for the Mumbai coast [6]. The spatiotemporal changes in the erosion and deposition of two Mediterranean river deltas over a 25-year period (1984–2009) were analyzed in [7]. Land-use change processes in Port Harcourt, which is a densely populated coastal city located in southeast Nigeria, have been analyzed over 27 years in [8]. The water quality of coastal waters was monitored based on chlorophyll-a in [9]. The mangrove forests in Malaysia were monitored and evaluated their significance to the coastal marine environment in [10]. The coastline changes and erosion-accretion evolution of the Pearl River Estuary were analyzed based on remote sensing images and nautical charts in [11]. The coastal and marine ecological changes and fish cage culture development in Phu Quoc, Vietnam, from 2001 to 2011 were estimated in [12]. The coastal sensitivity of Thiruvananthapuram on the west coast of India was assessed in [13].
METHODS FOR MONITORING COASTAL ENVIRONMENTS
As the intersection of land and sea, coastal zones are complex and variable. The traditional means of coastal zone research have certain limitations. Both the monitoring means and the monitoring intensity struggle to meet the demand of real-time monitoring due to coastal zone development, environmental changes, and disasters. Among the modern methods for monitoring terrestrial ecosystems, remote sensing is of primary importance due to its ability to provide synoptic information over wide areas with high acquisition frequencies [3]. Remote sensing has been used in resource development, the planning and management of the coastal zone, the monitoring of shoreline changes, and the understanding of physical processes in the coastal environment with geographic information systems (GIS) [14].
REMOTE SENSING
Remote sensing technology acquires and records information without coming into direct contact with an object. Remote sensing was redefined as the science and technology of Earth observation, including space to Earth observation, aerial observation, and field monitoring[15]. From this perspective, remote sensing data can be divided into data on a global scale, a regional scale, and a local scale. Global-scale satellites include static meteorological satellites, such as the GOES-8, the GOES-10, and the GMS meteorological satellite. The GOES-8 and the GOES-10 are the stationary satellites of NOAA. Their purposes are daily weather observations. These satellites provide a variety of meteorological and nonmeteorological services and play an important role in the study of global climate change, weather forecasting, disaster prevention, and disaster reduction.
Regional-scale data are generally obtained from moderate-resolution remote sensing images, such as MODIS sensor and Landsat satellites. MODIS is an important sensor equipped with Terra and Aqua satellites. Its multispectral data can reflect the information of land surface condition, ocean color, phytoplankton, biological geography, chemistry, atmospheric water vapor, aerosol and surface temperature, atmospheric temperature, and so on. Launched by the United States, Landsat satellites are primarily used to capture the remote sensing images of land, including soil organisms and plants. These satellites provide accurate and dynamic geographical information sources. Regional-scale data can be used in the macroscopic analysis of coastal zone changes, for example, see [6].Local-scale satellites are usually used for monitoring in a smaller scope with high resolutions, such as worldview satellite, airborne satellites, and unmanned aerial vehicles (UAVs). The benefits of high spatial and high spectral resolution data are their ability to match the rich spectral and spatial diversities observed in coastal systems. For example, The invasion of Spartina alterniflora was monitored using very high resolution UAV imagery in Beihai [16]. The results showed that UAV imagery can provide details on the distribution, progress, and early detection of S. alterniflora invasion, and the total accuracy was 94.0%.Based on the spectral types, satellites can be divided into optical satellites and microwave satellites. Hyperspectral and multispectral data provide more information for identifying targets. Unlike optical satellites, microwave satellites can penetrate through snow, soil, and forest. The benefit of combined optical and SAR-based approaches in improving classifications over some coastal habitats was demonstrated.Currently, remote sensing data are used in various ways: they serve as input boundary conditions and validation data for numerical simulation models, they are combined with in situ measurements to draw sediment transport maps, and they are assimilated in 3D coastal sediment transport models and in the light forcing of an ecosystem model [17].
GEOGRAPHIC INFORMATION SYSTEM (GIS)
GIS is an important and specific spatial information system. It is the technical system for the collection, storage, management, operation, analysis, display, and description of geographic distribution data for the entirety or a part of the Earth’s surface (including the atmosphere) in support of computer hardware and software systems. GIS has spatial analysis capabilities, can store and manage vast amounts of complex spatial data and attribute data, and can use spatial databases for the comprehensive analysis of multiple factors with quantity, quality, and localization. However, it is difficult to achieve attribute data modeling relying solely on GIS software.Combining GIS and mathematical models can make modeling easier by improving accuracy and solving problems effectively. For example, Anthony et al. used GIS with fuzzy learning vector quantization (FLVQ) for coastal vegetation classification. The classification accuracy of FLVQ was comparable to a conventional supervised multilayer perceptron, trained with backpropagation (KHAT accuracy: 82.82% and 84.66%, respectively; normalized accuracy: 74.60% and 75.85%, respectively), with no significant difference at the 95% confidence level [18]. An eutrophication model for Bohai Bay based on a cellular automata-support vector machine (CA-SVM) was established in [19] by applying the soft computing approach with a large quantity of remote sensing data to the marine environment. Their comparison between the optimized model and the basic model indicated that prediction accuracy was improved by the optimized model. The spatiotemporal patterns of phosphorus concentrations in a coastal bay were explored with machine learning models in [20]. GIS spatial analysis methods, along with mathematical models, can be used to analyze the interaction between coastal zone changes and the effects of human activities. These methods are very effective for coastal zone monitoring.
Methodology
LANDSCAPE CLASSIFICATION
Remote sensing image classification is an important way to extract information. Different surface features have different spectral characteristics. Landscape classification is the clustering of the same or similar pixels and the assigning of value to each pixel class through the analysis of spectral characteristics based on satellite remote sensing images.Landscape classification is a complex data processing task. Many factors, such as the spatial resolution of remote sensing images, different sources of data, and different classification methods, may influence the accuracy of landscape classification. The selection of the classification method is critical. Usually, classification methods can be divided into supervised classification approaches and unsupervised classification approaches. Supervised classification approaches identify the class of each pixel by selecting typical and representative training samples that the types are known already and training the classifier to classify the spectral data with the spectral characteristics of training samples. There are many classifiers, such as maximum likelihood, minimum distance, the SVM, the artificial neural network (ANN), and the decision tree. Unsupervised classification approaches are used to partition a spectral image into a number of spectral classes based on the statistical information inherent to the image. Unsupervised classification approaches merge spectral classes into meaningful classes based on the size of the similarity between pixels instead of training samples. The methods of unsupervised classification include, for example, the k-means algorithm, the iterative self-organizing data analysis method (ISODATA), and fuzzy clustering [21].
REGIONAL SCALE: AUTOMATIC CLASSIFICATION AND CHANGE DETECTION
On a regional scale, the data most frequently used in landscape classification and change detection are moderate spatial resolution remote sensing images, such as land-resource satellite data. Some traditional landscape classification methods require considerable labor and prior knowledge, and accuracy cannot be guaranteed. To reduce human intervention to a minimum and to achieve accurate classification rapidly, An efficient automatic landscape classification approach using prior accurate land-cover data as the background experience was proposed in [22-23]. This approach is distinguished from the previous semisupervised findings of landscape classifiers by adopting prior knowledge. It can be simply described in two steps: (1) detecting landscape changed pixels from satellite images compared with a prior landscape map and (2) classifying the landscape of changed pixels based on pattern recognition and changed rules.
· Automatic collection of training samples
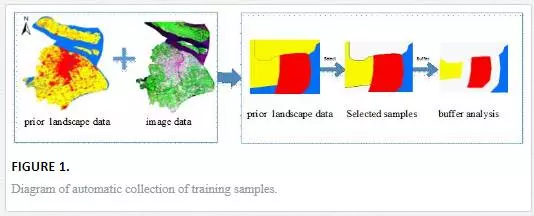
The first phase of this method is sampling, with a purpose of obtaining pure pixels of landscape classes. The selected training samples were used to ultimately convey the information to a three-dimensional feature space. The automatic collection of training samples is illustrated in Fig. 1.
· Establishment of three-dimensional feature space
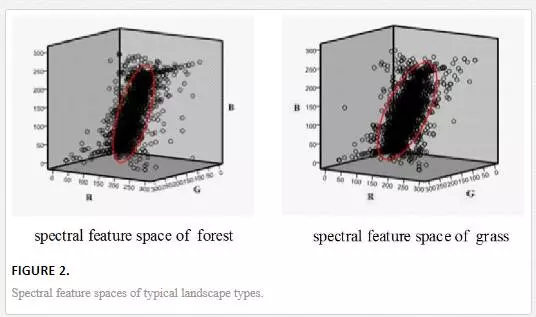
Principal component statistical analysis was used to process the data in all spectral bands of each landscape class, extracted by the region of interest. The first three principal components were selected for orthogonal decomposition to construct the three-dimensional feature space of different landscape classes. The three-dimensional spectral feature space of different landscape classes is established in the Fig 2.
· Change detection and classification
For each landscape class, all extracted cell spectral data of the same landscape class were used to calculate the values of the corresponding feature space. The pixels outside the corresponding three-dimensional feature space were considered the changed areas. After the changed pixels of the landscape were obtained, the satellite images and the three-dimensional feature space were employed to classify them based on pattern recognition and changed rules.
· Modification of postclassification results
There is an inevitable problem that a few individual pixels are inconsistent with the surrounding landscape class. The modification of postclassification results solved this problem by dilating operation and eroding operation on the classified results. The “salt-and-pepper” error is also a common problem. A moving window with a size of 3×3 pixels was defined to eliminate noise.
· Accuracy assessment and time-consuming evaluation
A kappa coefficient and a time-consuming evaluation were adopted to evaluate the practicability of classification. A kappa value equal to or greater than 0.61 was considered to be in good agreement. According to the requirements, a less time-consuming combination of Pa [accumulation area threshold (Pa) index] and Pbuffer (area threshold for buffer analysis) or a combination with a time-lapse rate minimum would form the optimal combination model.
LOCAL SCALE: OBJECT-ORIENTED CLASSIFICATION WITH HIGH-RESOLUTION IMAGE DATA
With the improvements in satellite sensor resolution, high-resolution remote sensing imaging has played an important role in relevant application fields. High-resolution remote sensing images contain rich information, such as spectral information, shape information, and texture information. High-resolution remote sensing images can clearly capture fine features and changes, such as port construction, roads, ecosystem characteristics, and species distribution (e.g., mangroves and invasive plant distribution). Pixel-based classification approaches are primarily based on the spectral information of pixels to extract feature information, and they do not make full use of rich spatial information (shape information and texture information) in the process of classification. According to the characteristics of high-resolution images, an object-oriented classification method was proposed in [24], which makes full use of spectral, shape, and texture information and obtain a high precision of classification results. Object-oriented classification is based on image segmentation to obtain a homogeneous image object and then analyze the spectrum, shape, and texture features to classify and extract the feature information. The main phases of classification are shown in the Fig 3.
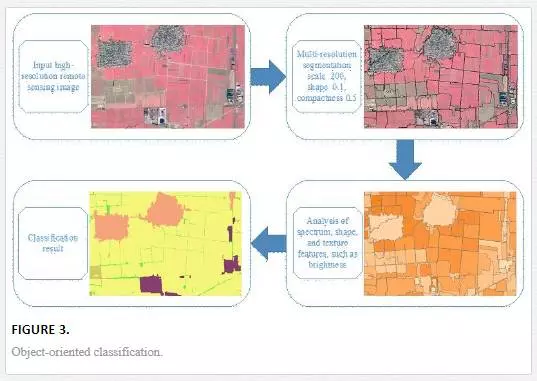
Object-oriented remote sensing image classification includes two key steps: multiresolution segmentation and classification.
1. Multiresolution segmentation
The multiresolution segmentation region grows and merges the algorithm and minimizes the average heterogeneity of image objects. The multiresolution segmentation algorithm consecutively merges pixels or image objects and is thus a bottom-up segmentation algorithm based on a pairwise region-merging technique [25]. Multiresolution segmentation algorithms include three factors: the band-weighting factor, the heterogeneity factor, and the segmentation scale. As the segmentation scale increases in size, the objects grow larger. Heterogeneity is composed of spectroscopy heterogeneity, shape heterogeneity, spectral weight, and the shape weight of four variables [26-27]:

where hcolor is spectroscopy heterogeneity, hshape is shape heterogeneity, wl is spectral weight, and 1-wlis shape weight.
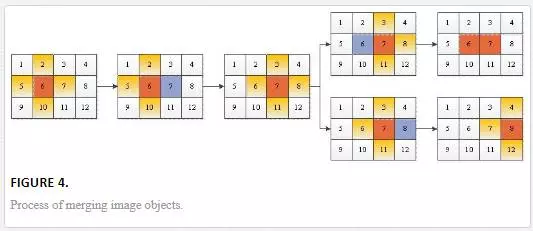
The multiresolution segmentation is the process of merging image objects in several loops in pairs starting with a single image object of one pixel. In each loop, the single image object acts as a seed to find its best-fitting neighbor in four directions or eight directions, as shown in Fig 4. If the best neighbor’s best-fitting neighbor is the seed, then the two pixels are merged into an image object. If otherwise, the best neighbor as a new seed begins to look for its own best-fitting neighbor until a pair of best-fitting image objects are found. The loops continue until the heterogeneity of each pair of image objects is greater than the segmentation scale.
1. Classification
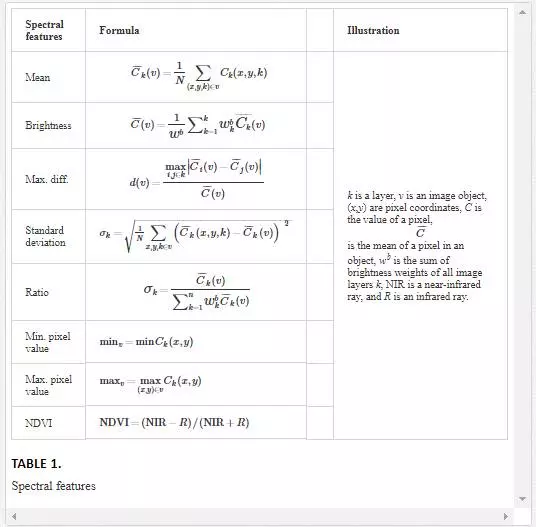
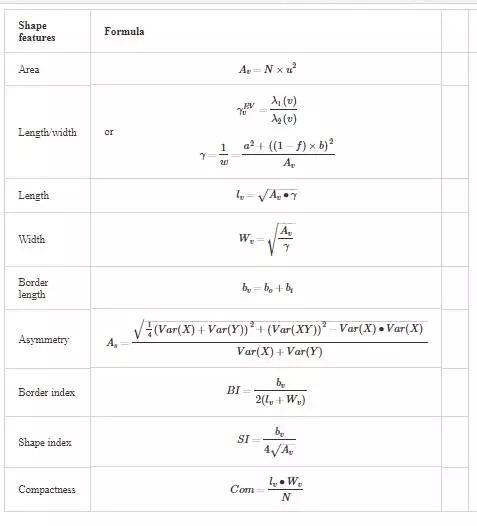
After segmentation, the image unit becomes an irregular polygon object composed of homogeneous pixels. The classification based on rules was achieved through comprehensively analyzing object features and establishing proper rule sets. Object features of remote sensing images are the necessary factor in object-oriented classification. There are three characteristics of an object: spectral features, shape features, and texture features.
The spectral features include mean, brightness, and poor standards (see Table 1).
The shape features include area, length/width, and length (see Table 2).
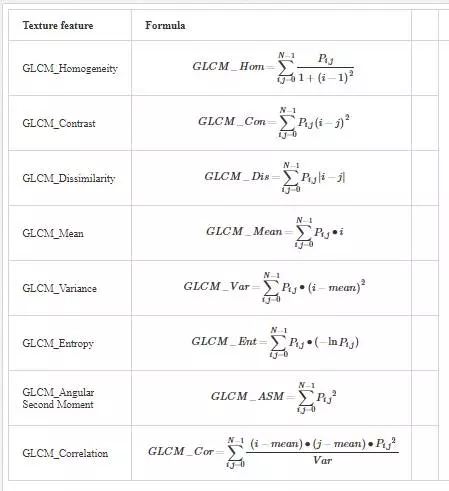
The texture features reflect the characteristics of the spatial distribution of pixels. The gray-level cooccurrence matrix (GLCM) is the most common statistical analysis method. GLCM provides the direction of an image’s grayscale, interval, and variation range, but it does not directly provide texture features. Based on GLCM, texture features include, for example, homogeneity, contrast, and dissimilarity (see Table 3).
1. Application of object-oriented classification based on remote sensing image
There are two key steps for classification: multiresolution segmentation and feature selection. Multiresolution segmentation is a crucial step transiting from image process to image analysis, and feature selection is the most important factor that influences the accuracy of classification. Taking the Changli Golden Beach National Ocean Natural Preserve as an example, we classified the landscape of this area using the object-oriented classification method.
· Multiresolution segmentation
According to the extracted object, the proper parameters are chosen to achieve the optimal segmentation result with scale 75, shape 0.1, and compactness 0.5 as shown in Fig. 5.

· Feature selection
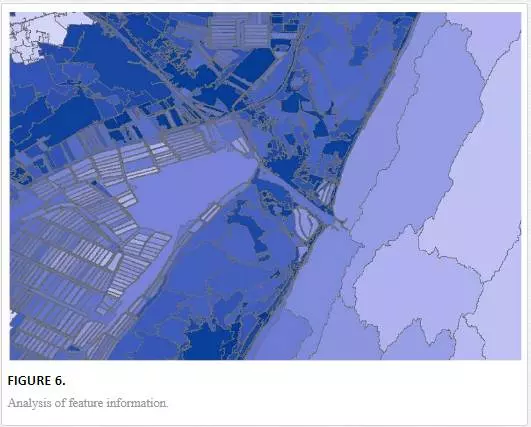
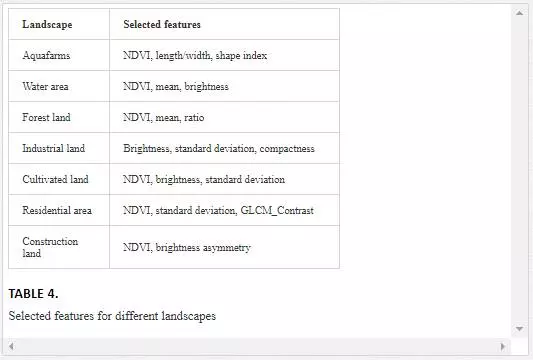
Feature selection is to select the spectral features, shape, and texture features for classification through the analysis of feature information, see the analysis result of feature information in Fig. 6. According to the classification targets (landscapes in Table 4), some features were selected and proper thresholds were set, such as normalized difference vegetation index (NDVI), mean, shape index, and brightness.
· Classification result
As shown in Fig. 7, the landscape mainly consists of aquafarms, water area, forest land, industrial land, cultivated land, residential area, and construction land. The classification result is reasonable through comparative analysis between the results and the original image.
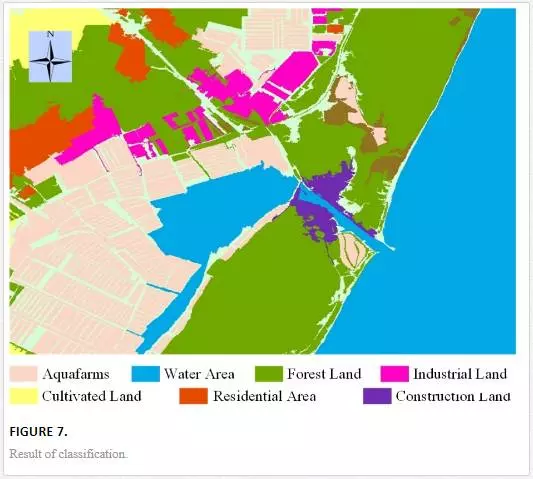
The object-oriented classification method we used in this study shows a good performance with the total accuracy of 89% and the kappa coefficient of 0.83. This method provides a high precision and a reasonable classification result.
RETRIEVAL OF ECO-ENVIRONMENTAL PARAMETERS BASED ON REMOTE SENSING TECHNIQUE
The parameters of land surface energy and water balance are important inputs for research on global climate change, crop yield assessment, and ecological environment evaluations. Remote sensing-derived radiation, temperature, and other data sets on a global scale have been used as standardized products in research and applications. Remote sensing information is convenient and easy to access over a large area at a low cost.
ENERGY- AND WATER-BALANCE PARAMETERS: SOLAR RADIATION AND EVAPOTRANSPIRATION (ET)
· Solar radiation
Solar radiation is the Earth surface’s most basic and important source of energy as well as the main driving factor of plant photosynthesis, transpiration, and soil evaporation land-surface processes [28]. Solar radiation is responsible for the formation and evolution of important climate driving forces. Changes in solar radiation change the temperature, humidity, precipitation, atmospheric circulation, the hydrological cycle, and other processes. Solar radiation is an important physical and ecological parameter in the land surface and atmospheric energy exchange process. Accurate solar radiation data retrieved from satellite data help improve net radiation, ET, and other precision products [29].
Geostationary meteorological satellite data have often been adopted as the data source for solar radiation and ET retrieval. GMS-5 data are easily acquired with a relatively high temporal resolution (1 h). GMS-5 data consist of three types of bands: (1) the visible (VIS) band with a spatial resolution of 1.25 km and a spectrum range from 0.55 to 1.05 μm, (2) the thermal infrared (TIR) band with a spatial resolution of 5 km and a spectrum range from 10.5 to 12.5 μm, and (3) the water vapor (WV) band with a spatial resolution of 5 km and a spectrum range from 6.2 to 7.6 μm. The VIS and TIR bands were employed for ET retrieval, and the WV band was used for calibration and validation.
Net radiation was calculated as the net result of the short-wave (solar) and long-wave (terrestrial) radiative fluxes, and it is expressed as a daily average:

where a is a surface albedo, which could be derived from the VIS data of the GMS-5; Ig is the daily average solar irradiation at the Earth’s surface; and Ln is the net long-wave (thermal) radiation loss.
Figures 8 and 9 show the spatial distribution of the global and net solar radiation of Asia in January, April, July, and October 2004, respectively.
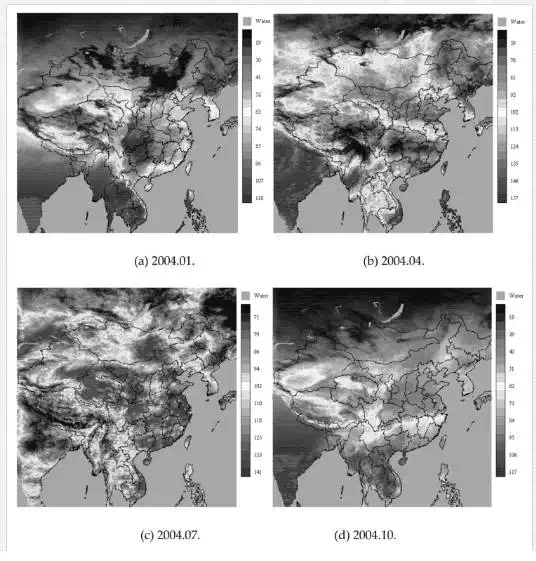
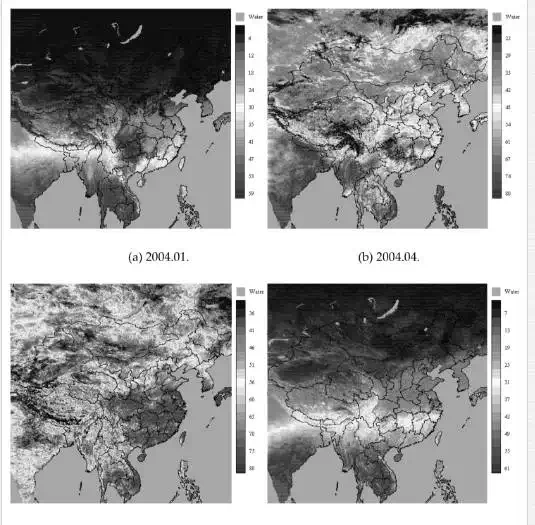
Solar radiation is an important factor in maintaining the Earth’s climate system and the ecosystem’s energy balance and is the main source of energy in the ecosystem, which plays an important role in the process of human development. Many environmental changes are related to solar radiation [30]. The use of satellite remote sensing data, particularly the stationary meteorological satellite data for observing a fixed surface area with the temporal resolution of 1 h, can greatly compensate for the lack of ground observation data. It is important to obtain long and continuous region surface solar radiation to analyze solar radiation’s spatial and temporal variation of the surface area. The analysis of surface solar radiation and climate change research will thereby be greatly facilitated.
· ET
Evapotranspiration (ET) is usually understood to be the sum of soil evaporation and plant transpiration, which is a soil-plant-atmosphere continuum system and an important process (SPAC) in water movement. ET is essential to crop growth and the development of water and energy sources. Ecological systems are an important link between land surface and hydrological processes, which are closely related to the strength and size of the underlying surface of plants. ET can be said to be both a surface heat-balance component and an important part of water balance. ET is highly variable across space due to changes in precipitation, soil hydrological parameters, and vegetation type and density. Its strong spatial variability across time is due to climate changes at different times.
Calculation of the sensible heat flux: The sensible heat flux into the atmosphere is proportional to the temperature difference across the atmospheric boundary layer (T0–Ta). The simple formulation is
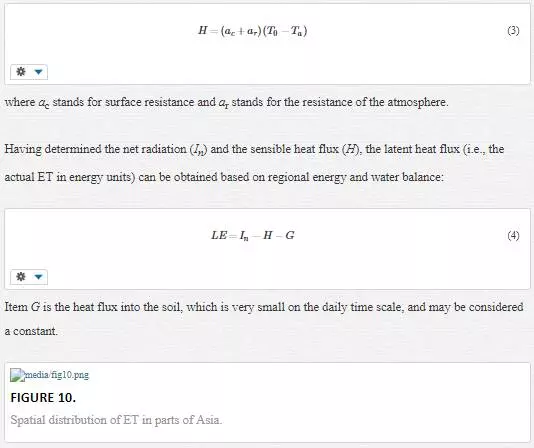
Figure 10 shows the spatial distribution of the ET of Asia in January, April, July, and October 2004 and reveals the significant differences between the distributions of different months of relative ET space. Relative ET was higher at low latitudes than at high latitudes and varied across months. Due to the lush plant growth in July, relative ET is generally high in most of Asia. In January, in most of Asia, including the South and Southeast Asian countries, there are low temperatures and generally low relative ET.Many ecosystem processes, such as soil moisture changes, vegetation growth, and nutrient cycling, are closely linked to the ET process. The ET process is affected by climate, soil characteristics, and vegetation growth status [31-32]. Therefore, the calculation of ET reveals the changes in the time of ET and its impact factors to quantify the contribution of plant transpiration and soil evaporation to ET. ET can not only reveal various land-surface (vegetation, particularly surface) water consumptions [33] but also help us understand the effect of global warming on the actual ET and water balance, land surface ecology, and environment. ET can also improve climate models and accurately simulate climate change, which is important.
VEGETATION: VI, PHOTOSYNTHETICALLY ACTIVE RADIATION (PAR), AND NET PRIMARY PRODUCTIVITY (NPP)
· VIs
VIs are used to evaluate fractional vegetative covers qualitatively and quantitatively, including the leaf area index (LAI), chlorophyll concentration, photosynthetic activity, biomass, and vegetation growth. Most of them are derived from satellite data or spectrometers using the spectral information of vegetation [34-35]. Time-series VIs that use observations of the Earth from a space platform are a valuable way to derive several plant biophysical parameters for ecological, hydrological, and climate models and to study land-use land-cover change dynamics [36]. VI has been one of the primary sources of information for the operational monitoring of the Earth’s vegetative cover. So far, more than 150 indices have been defined for different purposes and optimized to assess a process of interest because it is not possible to design an index that is sensitive to only the desired variable and totally insensitive to all other vegetation parameters [37].[38] presented the most well-known and widely used VI, the NDVI. To compensate for soil background influences and atmospheric effects, the average NDVI of different surface temperatures of diverse surface types was computed in [39]. The improved indices, such as the renormalized difference VI (RDVI), the perpendicular VI (PVI), and the modified simple ratio (MSR), linearized the relationships with vegetation biophysical variables. Then, MSR was suggested as an improvement over RDVI in combination with the simple ratio (SR=NIR/Red) [40]. SR and MSR are considered more linearly related to vegetation parameters.
The soil-line VIs, soil-adjusted VI (SAVI), an improved SAVI (MSAVI), and the soil and atmospherically resistant VI (SARVI) improved the resistance to soil and atmospheric effects.
New VIs based on three discrete bands, the chlorophyll absorption ratio index (CARI), the modified CARI (MCARI), and the triangular VI (TVI), have a strong correlation between leaf chlorophyll concentration and reflectance ratios. New and improved VIs for green LAI predications, MCARI1, MCARI2, MTV1, and MTV2, showed the best linear relationships between NIR reflectance and VIs [35].
· PAR
PAR is solar radiation that can be absorbed through the processes of chlorophyll synthesis and the photosynthesis of plants and then transformed into chemical energy in the waveband of 400 to 700 nm [41-42]. PAR is an important factor for plant growth and development. Many studies have shown that PAR contributes significantly to plant physiology, biomass production, biometeorology, energy budget, and the Earth’s climate system [42-43]. The monthly gross primary production (GPP) was estimated and calibrated using the enhanced VI (EVI) and PAR in [44]. The ratio of PAR with global solar radiation has been found generally decreased with various sky conditions in each month at FuKang in northwest China[45]. It was reported in [46] that the PAR and UVR interacted during photoinhibition and could initiate the protein repair of cyanobacterium Arthrospira platensis. The PAR losses in the atmosphere were associated with “photochemical factors”, and other materials in North China depended on spatial and seasonal changes [47].Absorbed PAR (APAR) is a key parameter for estimating PAR absorbed by the green canopy during photosynthesis. The carbon exchange between the crop canopy and the atmosphere is primarily controlled by the amount of APAR by the light use efficiency (LUE). APAR is determined by the fraction of PAR (FPAR) and the total solar surface radiation (SOL; MJ m-2; [48]:

where the constant 0.5 represents the ratio of the total solar radiation (with a wavelength range of 0.4–0.7 μm) used by the vegetation.
· NPP
NPP represents the organic matter accumulated by plants per unit area and time. From an ecological perspective, NPP measures the rate at which solar energy is stored by plants as organic matter. NPP is influenced by climate, soil, vegetation type, and human activities [49]. For various ecological monitoring activities, NPP is generally regarded as an important factor that provides a comprehensive evaluation of ecosystem status and services, including productivity capability, habitat and wildlife, and ecological footprint [50-51].
NPP is not a directly observable ecosystem characteristic, and it is difficult to measure accurately over large areas [52-53]. A number of NPP models have been developed. Regression-based models such as the Miami model, process-based models such as simple models based on LUE, and mechanistic models based on soil-vegetation-atmospheric transfer (SVAT; [54-55] need more parameter requirements and complexities. Satellite data-driven production efficiency models (PEMs), such as the Carnegie-Ames-Stanford approach (CASA; [48], TURC [56], and GLO-PEM [57], have been used to analyze the spatiotemporal patterns of NPP over continents and global land surfaces [58-61].
The CASA model is a biogeochemical model that uses a system of first-order linear differential equations to represent the flow of carbon between various pools and to track the long-term changes in terrestrial carbon stocks on a monthly time-step. This model computes the NPP as a function of APAR and LUE [48]:

where x represents the grid cell, t represents the period that NPP is accumulated, LUE(x,t) represents the actual LUE [62].
INTEGRATED ANALYSIS OF COASTAL ENVIRONMENT SUPPORTED BY GIS
FACTORS OF COASTAL ENVIRONMENT ANALYSIS
Coastal zones and shelf seas are influenced by both natural and socioeconomic conditions. An integrated evaluation criteria system was set up, which contained nine factors belonging to three categories: (1) environmental background factors, including elevation, slope, geomorphological types, accumulated temperature, and a wetness index; (2) water/land resources, including precipitation, river density, and land use; and (3) socioeconomic factors, including railway density, road density, and population density. However, human life and development may also directly or indirectly affect costal zones and shelf areas, including mariculture and marine fishing production, sea pollution, and others (e.g., building, sports, and travel).
MODEL
· Analytical hierarchy process (AHP) method
To evaluate such complex factors, the AHP or Delphi method provides a good solution. The AHP is a decision-making method in qualitative and quantitative analysis, which is associated with the decision scheme of elements decomposed into goals, principles, and levels. The characteristics of the AHP are based on the nature of complex decision problems, influencing factors, and inherent relationship depth analyses using quantitative information with fewer decisions to construct a mathematical thinking process with multiobjective, multicriteria, or nonstructural properties of complex decision-making problems. The AHP is an easy method to use. However, there are many disadvantages, such as the overuse of the data statistic index, making the weight difficult to determine. Quantitative data are fewer in number and not as convincing. Therefore, many new models have emerged to analyze these factors.
· Neural net
Neural net classification was used to analyze land growth due to coastline changes over different periods based on TM imaging. ANNs may be of significant value in extracting vegetation-type information in complex vegetation mapping problems, particularly in coastal wetland environments. Further remote sensing research involving fuzzy ANNs is also needed.Feature extraction methods are optimized for high-dimensional data analysis by ANNs. One example is the decision boundary feature extraction (DBFE) algorithm [63]. In addition, the growing neural gas (GNG) algorithm [64] could be utilized to enhance outlier detection capability by inserting a new processing unit in the vicinity of the neuron with the highest requanitization error.In general, all neural algorithms have higher classification accuracies, which can help address complex vegetation mapping problems and improve hyperspectral images and MODIS data classification accuracies.
Support vector machine (SVM)
SVM is a supervised learning model that is usually used for pattern recognition, classification, and regression analysis. The CA-SVM was established by applying the soft computing approach with a large quantity of remote sensing data to the marine environment.Two main tasks were undertaken in this study. First, to choose reasonable influence factors as the input parameters of the model, nine series of training and simulation exercises were conducted based on nine different types of input parameter combinations. A reasonable input parameter combination was selected, and the eutrophication model (the basic model) was established by the comparative analysis of the simulation results. Second, according to Shelford’s law of tolerance, an optimized model was developed. The model combines nine special models, and each model corresponds to a stage of SST and chlorophyll-a concentration, respectively.In general, SVM is a more optimized coupling model, and prediction accuracy is improved. This model could provide a scientific basis for the prediction and management of the aquatic environment of Bohai Bay.
· Ecosystem modeling
Ecosystem models are powerful tools for anticipating future conditions and exploring carrying capacity. These models allow for the study of stocks, energy fluxes, and potential interactions in complex coastal ecosystems. However, the application of ecosystem models in the analysis of the coastal environment has been limited partially due to the cost involved in generating and testing the models. Therefore, the use of more generic and flexible models could facilitate the implementation of modeling. A physical-biogeochemical coupled model for studying the long-term processes in shallow coastal ecosystems was presented in [65]. The biogeochemical model was constructed in Simile, a visual simulation environment software that is well suited to accommodate fully hydrodynamic models. Specifically, Simile integrates PEST (a model-independent parameter estimation), an optimization tool that uses the Gauss-Marquardt-Levenberg algorithm and can be used to estimate the value of a parameter or set of parameters to minimize the discrepancies between the model results and a data set [66]. The other critical aspect of modeling exercises is the large amount of data necessary to set up, tune, and ground truth the ecosystem model. Tools such as remote sensing, scenario analysis, and optimization can help fill these data gaps. Recently, satellite remote sensing has been used to feed individual-based models to predict bivalve growth [67-68] even in data-poor environments. GIS tools and optimization have been employed to collect and use data for developing ecosystem models in aquaculture data-poor sites. Similarly, a study has been conducted to evaluate the best site for shellfish aquaculture in Valdivia (Chile), which combines GIS-based models with a farm-scale carrying-capacity model [69-70].
In general, ecosystem modeling and optimization are ideal tools for a marine environment; as described, ecosystem modeling combines existing models, remote sensing data sets, and GIS tools into a fully spatial model to provide an integrated analysis method for optimizing coastal environments from a sustainable ecosystem standpoint.
INTEGRATED ANALYSIS SUPPORTED BY GIS
Coastal environmental comprehensive assessment involves many factors, including the spatial pattern of ecological environment quality conditions. However, the above method reflects the quality situation of the coastal environment in longitude, excluding the spatial distribution of the evaluation results. To grasp the overall quality of the coastal environment condition, the in-depth analysis of its spatial pattern is indispensable. GIS technology has a strong spatial analysis function to make up for the deficiencies of these methods. Therefore, it is helpful to improve the level of coastal environmental assessment through integrating GIS and these models.In the field of suitability assessment for coastal environments, GIS, remote sensing, and numerical modeling techniques have been shown by recent studies to be efficient tools. The land-use suitability analysis was reviewed based on GIS in the United States in [71]. A GIS-based geo-environmental evaluation for urban land-use planning was presented in [72]. An integrated GIS-based analysis system for the land-use management of a lake area in the urban fringe in central China was built up in [73], and the analytic hierarchy process (AHP) method was adopted to derive weights for the evaluating model. Similarly, an integrated evaluation of urban development could be conducted in an operational way using remote sensing data, the GIS spatial analysis technique, and the AHP modeling method [74]. Satellite remote sensing has been used to feed individual-based models to predict bivalve growth [66] even in data-poor environments. A study was conducted in [69] to evaluate the best site for shellfish aquaculture in Valdivia (Chile), combining GIS-based models with a farm-scale carrying-capacity model.
In general, the integration of GIS with digital models provides a new way that makes full use of the powerful spatial analysis function of GIS and the advantage of a multifactor comprehensive evaluation of model for improving the level of coastal environment quality evaluation. Moreover, GIS has great advantages in data processing, management, and analysis, and it can objectively reflect the coastal environment states and problems in horizontal aspect. Many research results indicate that the integrated analysis of the coastal environment supported by GIS has important theoretical and practical significance.
Case study
Several typical ports with different stages of development were selected as the study regions: (1) Zhan Jiang Port, China, East Asia; (2) Gwadar Port, Pakistan, South Asia; (3) Djibouti Port, Republic of Djibouti, East Africa; and (4) Ilichevsk Port, Ukraine, Eastern Europe (see Fig. 11).
The ports and their coastal surroundings were selected for a comparative study of the spatiotemporal changes in the coastal environment using time-series satellite imagery and GIS methods.
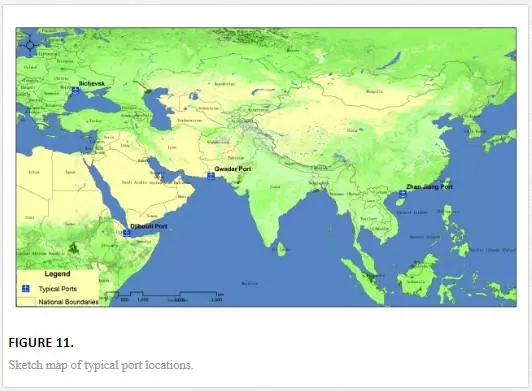
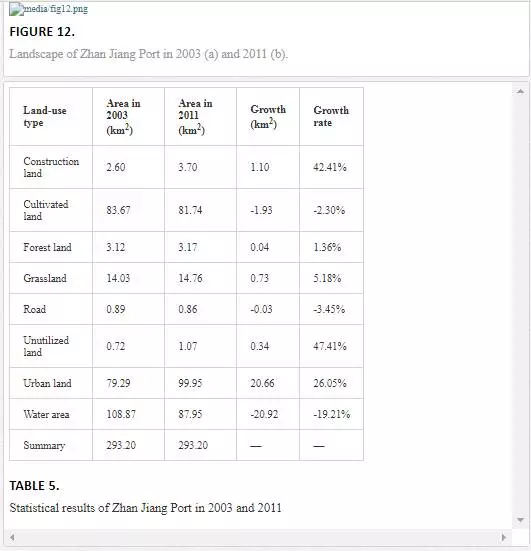
Figure 12 shows that, in the northern part of Zhan Jiang Port, the cultivated land, water area, and urban land were reduced significantly, whereas unutilized land and construction land increased from 2003 to 2011. The middle part shows a reduction in grassland and an increase in unutilized land. The southern part shows a reduction of construction land and a reduction of unutilized land.The landscape types of Zhan Jiang Port were based primarily on the water area, cultivated land, and urban land. From 2003 to 2011, the urban land increased the most, with a percentage of 26.05%. The water area was reduced the most.
Overall, the urban land of Zhan Jiang Port increased significantly, whereas the water area was reduced significantly. However, other landscapes did not obviously increase or decrease. Therefore, the landscape of Zhan Jiang Port from 2003 to 2011 was relatively stable with a small trend of sea reclamation, and Zhan Jiang Port was at the stage of specialization.
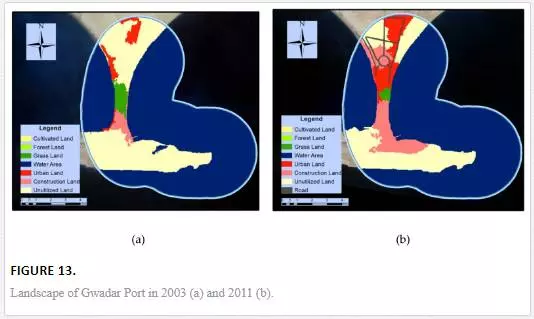
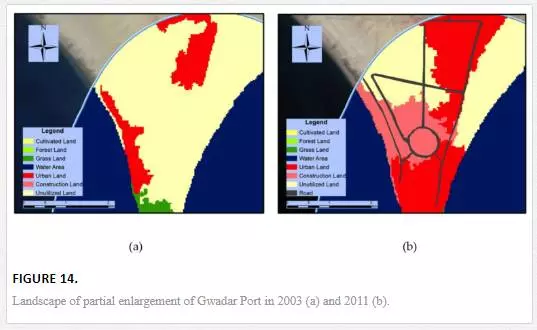
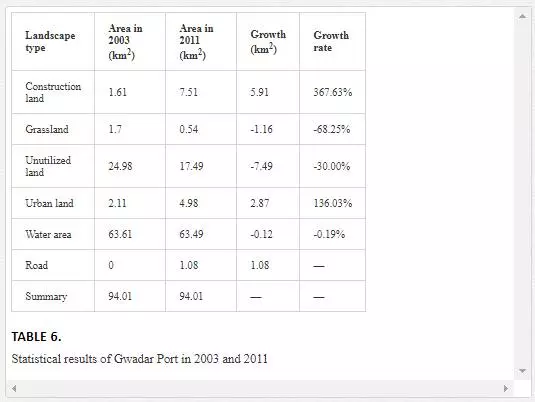
As shown in Fig. 13, the landscape of Gwadar Port changed significantly from 2003 to 2011. Construction land and urban land increased significantly by occupying the grass land and unutilized land. However, the most obvious change was the construction of the main road. In 2003, the main road of Gwadar Port was too small to be identified by the Landsat TM imagery, whereas, in 2011, it was clearly identifiable (see Fig. 14).
The landscape types of Gwadar Port were based primarily on unutilized land and water areas in both 2003 and 2011. From 2003 to 2011, construction land, urban land, and road increased and the unutilized land, grass land, and water area were decreased. From Table 5, we come to the conclusion that Gwadar Port was in the expansion stage, with a massive increase in construction land and urban land.
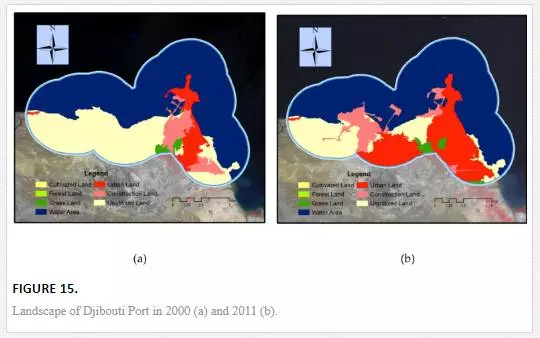
As shown in Fig. 15, the landscape of Djibouti Port had a significant change from 2000 to 2011. Urban land, grass land, and construction land increased a lot, whereas unutilized land and water area were reduced. In the eastern part of Djibouti Port, the landscape-type changes were construction land to urban land, whereas, in the middle and western parts of Djibouti Port, the changes were primarily from unutilized land to urban land and construction land. The change pattern of landscape indicated that the expansion of Djibouti Port was from east to west. By 2011, the eastern part of Djibouti Port was developed, and the middle part was under construction, whereas the western part had not been developed yet.
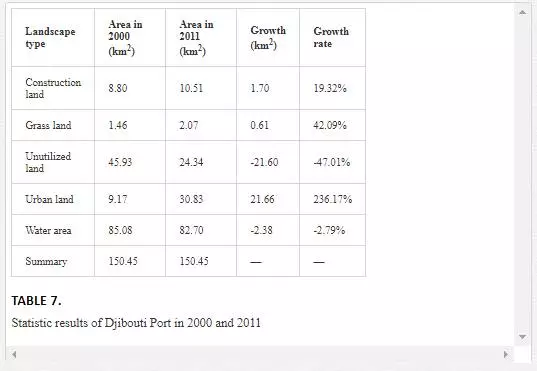
The unutilized land was the second largest area in 2000 in Djibouti Port, whereas urban land became the second in 2011, with an increase of 21.66 km2. The great increase of urban land and great decrease of unutilized land indicated that Djibouti Port developed a lot from 2000 to 2011, and the increase of construction land showed that Djibouti Port was still expanding in 2011.

From Fig. 16, we know that construction around the water area increased slightly, and urban land in the western part decreased. From Fig. 17, we can see that some cultivated land in this region changed to urban land, especially around the water area. All in all, the landscape structure remained stable from 2003 to 2011 in general, with urban expansion in northeast Ilichevesk. The landscape structure of Ilichevsk Port was based primarily on water area, urban land, and cultivated land both in 2003 and 2011. From 2003 to 2011, urban land increased only 2.21 km2. Thus, the landscape structure of Ilichevsk Port remained stable from 2003 to 2011 in general, with the main trend of expansion in the northeast part.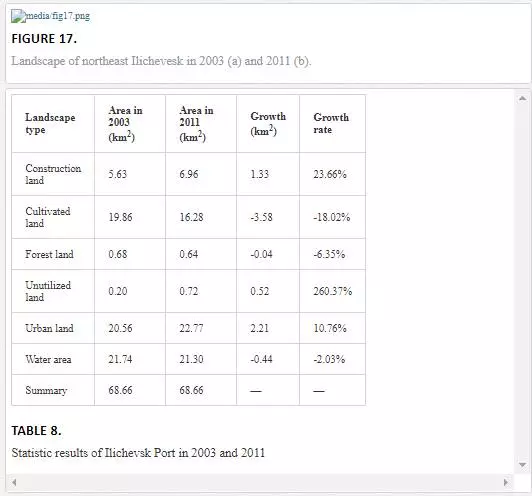
Conclusions
In this chapter, we first discussed the automatic classification and change detection on a regional scale and the objective-based classification with high-resolution image data on a local scale for the landscape classification. We then retrieved the eco-environmental parameters based on remote sensing techniques, including solar radiation, ET, VIs, PAR, and NPP. On this basis, we introduced the mathematical models, including the AHP, the neural net, SVM, and ecosystem modeling, which can be combined with GIS for an integrated analysis of coastal environments. Finally, we used typical ports (Zhan Jiang, Gwadar, Djibouti, and Ilichevsk) as examples for landscape classification and analyzed the spatiotemporal variation from 2003 to 2011.
Zhan Jiang Port was at the stage of specialization. The landscape was relatively stable with a small trend of sea reclamation from 2003 to 2011. In the northern part of Zhan Jiang Port, the cultivated land, water area, and urban land were reduced significantly. The middle part shows a reduction of grassland and an increase in unutilized land. The southern part shows a reduction of construction land and a reduction of unutilized land. Gwadar Port was in the expansion stage, with a massive increase in construction land and urban land. Construction land and urban land in Gwadar Port increased significantly by occupying the grassland and unutilized land. However, the most obvious change was the construction of the main road. Djibouti Port developed considerably from 2000 to 2011, and the small increase in construction land in 2011 shows that Djibouti Port was still expanding. The urban land and construction land increased significantly, whereas unutilized land and water area were reduced. Ilichevsk Port remained generally stable from 2003 to 2011, with the slight trend of expansion in the northeast part. The coastal zone represents a comparatively small but highly productive and extremely diverse system with a variety of ecosystems. Because of its characteristics of complex and diversity, the modern methods such as remote sensing and GIS become more and more important for the coastal environment. Remote sensing has the ability of wide and frequent information acquisition and GIS has the ability of spatial analysis. Therefore, they are very effective for monitoring the shoreline changes, understanding the physical processes in the coastal environment, planning and managing the coastal zone, and analyzing the interaction between coastal zone changes and the effects of human activities.
